���,��һ��ͬѧ��æ����һ��GUI����������ʹ�õ���Python��
matplotlib��������,������ʾ����,��ʹ��Duilib��Ƕ���������ڽϴ������,��Ҫ����python��֧��,��Ҫ��Ƕ����,������û���֮�����İ�ť���漰����һ�����鷳,�������վ�������ʹ��python�������GUIӦ�ó���
? ����֮ǰ�й�C++Qt�Ļ���,���ϼȽ�python�ļ���GUI��,���վ�������PyQt5�⡣
? �����������Python3���б�д,����PyQt5��matplotlib��pandas�ȵ�������,������һ��С������ʵ��ʵʱ��ȡ�Ŵ�ǰ����ͼ��
? ������˵,������Ҫ��װ���������֧��,����ʹ��pip��װ��matplotlib��֮��Ļ�Ƚ��鷳,��װ����ʹ�õ�ʱ��ᱨ��,����Ҳ���˺ܶ�취,���ֶ��DZȽ��鷳��,����,�����Ƚ�nan,��ֱ��װ��anaconda3,��������˴���Ҫʹ�õ���,������ٶ��������,���ذ�װ,��װ���Ż�ռ��1��g�����ݡ�
? ����PyQt5,�Ϳ��Լ�ʹ��pip install PyQt5����ֱ�Ӱ�װ��!
? ��װ���,��ʼ������,��д����:
? ���ȱ�дmatplotlib��صĻ�������
class BaseOscillograph(FigureCanvas):
# �����ź�
PosChangeSignal = QtCore.pyqtSignal(int,int)
WheelChangSignal = QtCore.pyqtSignal(int)
def __init__(self, parent=None, width=5, height=4, dpi=100):
self.WheelValue = 0 #Wheel Default Value
#Matbleʵ��
fig = Figure(figsize=(width, height), dpi=dpi)
self.axes = fig.add_subplot(111)
self.axes.hold(False)
FigureCanvas.__init__(self, fig)
self.setParent(parent) # ���ø�����,�����봰������
FigureCanvas.setSizePolicy(self,QSizePolicy.Expanding,QSizePolicy.Expanding)
FigureCanvas.updateGeometry(self)
# �ı���ʽ
self.pixmap = QPixmap("./img/border.png")
self.scaledPixmap = self.pixmap.scaled(QSize(100, 100), Qt.KeepAspectRatio) # �����С ����������ͼƬ
newCursor = QCursor(self.scaledPixmap, -1, -1)
self.setCursor(newCursor)
def wheelEvent(self, event):
delta = event.angleDelta()
oriention = delta.y() / 8
if oriention > 0:
self.WheelValue -=10
else:
self.WheelValue +=10
#Fix Value
if self.WheelValue > 100:
self.WheelValue =100
if self.WheelValue <-40:
self.WheelValue = -40
self.scaledPixmap = self.pixmap.scaled(QSize(120+self.WheelValue, 120+self.WheelValue), Qt.KeepAspectRatio)
newCursor = QCursor(self.scaledPixmap, -1, -1)
self.setCursor(newCursor)
self.WheelChangSignal.emit(self.WheelValue) # Send Signal To Provide Current WhellValue
def mouseMoveEvent(self, event):
pos =event.globalPos()
self.curX = pos.x()
self.curY = pos.y()
self.PosChangeSignal.emit(self.curX,self.curY)
super().mouseMoveEvent(event)
�ֱ������۵ĺ��Ĺ��ܽ��ڸ���ʵ��,����wheelEvent����,���ڻ�ȡ�������¼�,����self.WheelValue�������ڼ�¼��ǰ�����ֵ�ֵ,���ڷ��͵�������,�������ȡ��̬�ı���ʾ��С�ı���,ʵ�ַŴ���С��Ч����ÿ�ι�������ֵΪ10,����Ҳ�����������Ӹ�ȫ�ֱ���,�����ʹ�ö�ȡ�����ļ��ķ�ʽ,��̬�ı���һֵ��
? ÿ�θı��,ʹ��emit�����ֵ���ͳ�ȥ,�������ڳ����ȡ�������ı䡣
? ͬ���ķ�ʽ,���ø�дmouseMoveEvent�ķ���,����ȡ�ĵ�ǰ���λ�ñ�������,������������
����������Ҫ��д�����ʵ�ִ�����,�̳���BaseOscillograph
#ȫ�ֱ���
i=0
j=200
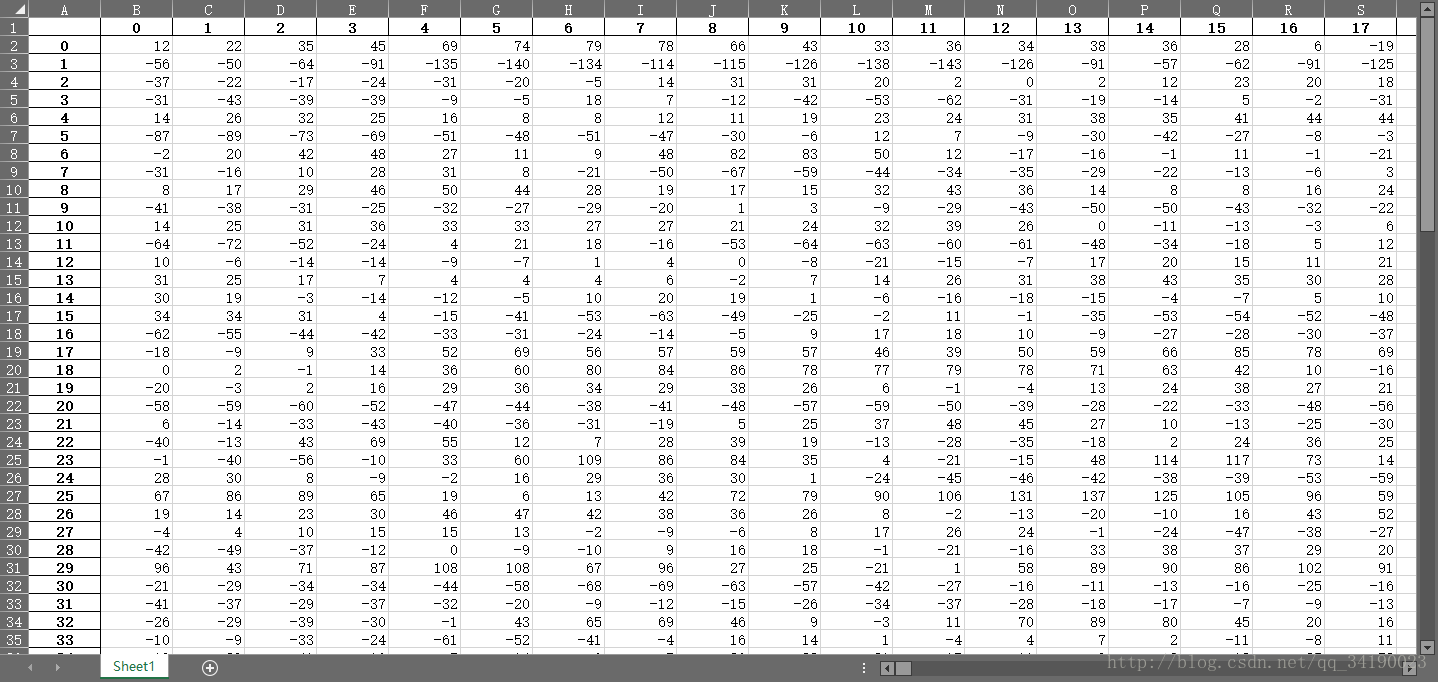
data = pd.read_excel(r'./data/signalData.xlsx')
data = np.array(data)
class MatplotOscillograph(BaseOscillograph):
def __init__(self, *args, **kwargs):
BaseOscillograph.__init__(self, *args, **kwargs) #���ø���Ĺ�����
self.timer = QtCore.QTimer(self)
self.timer.timeout.connect(self.update_figure) # FIXME : ���ÿ����̵߳ķ�ʽ
self.timer.start(100)
def update_figure(self):
# TODO : �˴�����Ҫ�����߳��� �漰�߳�ͨ��
global i,j
self.axes.plot(data[i,j-200:j], 'r')
self.axes.set_ylim([data[i,:].min(),data[i,:].max()])
j = j + 5
if j > 4096:
j = 0
i = i + 1
self.draw()
def stopRun(self):
self.timer.stop()
def beginRun(self):
self.timer.start(100)
�������Ȳ��üIJ��Է���,��excel�ļ���������ݵ����������������ź�,���ж�ȡ(����Ķ�ȡֻ�Dz�����,������Ҫ�����̵߳ķ�ʽ���ж�̬��ȡ,��̬�ı䲨��ͼ,���ڱ�������ϸ����),����ʹ�üĶ�ʱ������,��ʱ��ȡ����,�������ݶ�ȡ��ʾ��Ϊ����ͼ,��Ȼ,��������Ҫ�ĵ�,ֻ�������á�
excel���������ݺܼ�,��ʵ���Ƿµ�ʱ�����������������ݡ�����û�п����̶߳�̬��ȡ,���������ʱ�����Ϊ��ȡ����,��ʾ����Ƚϻ������������ö�̬��ȡ���������������ݽ���������������
��������ʵ��:
class ApplicationWindow(QMainWindow):
def __init__(self):
QMainWindow.__init__(self)
self.Init()
def Init(self):
# InitWindowAttribute
self.setAttribute(QtCore.Qt.WA_DeleteOnClose)
self.setWindowFlags(Qt.FramelessWindowHint) #ȥ��������
# ����״̬�� ����,������Ϊ״̬����ʱ��
self.statusBar().showMessage(u"�ĵ��źŲ���ͼ")
#
self.SetStyle()
self.InitData()
self.InitProperty()
self.InitLayout()
def SetStyle(self):
qssFile = open("qss\style.qss").read()
self.setStyleSheet(qssFile)
self.setWindowIcon(QIcon("img/15d.ico"))
def InitData(self):
# Param
self.WheelValue = 0 #Ĭ��Ϊ0
self.FitstMove = 1
self.bImgRun = 1
self.curX = -1
self.curY = -1
# Control
self.image = QPixmap()
self.picture = QLabel()
self.minBtn = QPushButton()
self.exitBtn = QPushButton()
self.aboutBtn = QPushButton()
self.analyResText = QTextEdit()
# Others
self.timer = QtCore.QTimer(self) # ��ʱ��
def InitProperty(self):
self.image.scaled(QSize(300, 300), Qt.KeepAspectRatio)
#
self.picture.setFixedSize(300, 300)
self.picture.setScaledContents(1)
#
self.analyResText.setAttribute(Qt.WA_TranslucentBackground, 1)
# Updata
self.timer.timeout.connect(self.updateCurImg)
#
####
# Init ToolBar
self.minBtn.setIcon(QIcon("img/btn_mini_normal.png"))
self.minBtn.setMaximumSize(20, 20)
self.minBtn.setIconSize(QSize(30, 30))
self.minBtn.clicked.connect(self.windowMin)
#
self.exitBtn.setIcon(QIcon("img/btn_close_normal.png"))
self.exitBtn.setMaximumSize(20, 20)
self.exitBtn.setIconSize(QSize(30, 30))
self.exitBtn.clicked.connect(self.fileQuit)
#
self.aboutBtn.setIcon(QIcon("img/list_icon_b.png"))
self.aboutBtn.setMaximumSize(20, 20)
self.aboutBtn.setIconSize(QSize(30, 30))
self.aboutBtn.clicked.connect(self.about)
#
####
#
def InitLayout(self):
###
# Main Frame And Layout
frame = QWidget()
frameLayout = QVBoxLayout(frame)
#
###
# TitleLayout
titleLayout = QHBoxLayout()
toolBarLayout = QHBoxLayout()
#
ico = QToolButton()
ico.setIcon(QIcon("img/15d.ico"))
title = QLabel(u"�ĵ��źŲ��ν���")
#
toolBarLayout.addWidget(QLabel())
toolBarLayout.addWidget(self.aboutBtn, 1)
toolBarLayout.addWidget(self.minBtn, 1)
toolBarLayout.addWidget(self.exitBtn, 1)
#
titleLayout.addWidget(ico)
titleLayout.addWidget(title)
titleLayout.addLayout(toolBarLayout)
#
###
# CenterLayout
centerLayout = QHBoxLayout()
rightLayout = QVBoxLayout()
# MatbalWindow
matplotWindow = MatplotOscillograph(frame, width=5, height=4, dpi=100)
matplotWindow.PosChangeSignal.connect(self.showCurImg)
matplotWindow.WheelChangSignal.connect(self.wheelChange)
#
rightLayout.addWidget(self.picture)
rightLayout.addWidget(QLabel(u"�������:"))
rightLayout.addWidget(self.analyResText)
#
centerLayout.addWidget(matplotWindow, 2)
centerLayout.addLayout(rightLayout, 1)
#
###
# ButtonLayout
bottonLayout = QHBoxLayout()
# Buttons
stopBtn = QPushButton(u"��ͣ����ͼ")
beginBtn = QPushButton(u"����ͼ�˶�")
self.beginImgBtn = QPushButton(u"�۲춯ͼ")
self.analyCom = QComboBox()
#
# TODO : ��ģʽ����
self.analyCom.addItem(u"����1")
self.analyCom.addItem(u"����2")
self.analyCom.addItem(u"����3")
self.analyCom.addItem(u"����4")
self.analyCom.addItem(u"����5")
# Signals and slots
stopBtn.clicked.connect(matplotWindow.stopRun)
beginBtn.clicked.connect(matplotWindow.beginRun)
self.beginImgBtn.clicked.connect(self.beginImgRun)
self.analyCom.currentIndexChanged.connect(self.analyFunction)
#
bottonLayout.addWidget(stopBtn)
bottonLayout.addWidget(beginBtn)
bottonLayout.addWidget(self.beginImgBtn)
bottonLayout.addWidget(self.analyCom)
#
###
# MainLayout
frameLayout.addLayout(titleLayout)
frameLayout.addWidget(QLabel().setMaximumHeight(20))
frameLayout.addLayout(centerLayout)
frameLayout.addLayout(bottonLayout)
#
### Others
# setFocus And CentralWindow
frame.setFocus()
self.setCentralWidget(frame)
#
###
# # Slot Functions # #
def fileQuit(self):
self.close()