1. 从官网选择Prometheus版本进行下载
官网地址>> https://github.com/prometheus/prometheus/releases/
2. 实验安排
在主机192.168.153.137上安装prometheus监控192.168.153.138上的mysql服务和主机状态
3. 上传软件包到137服务器并配置
3.1 将软件包解压到 /usr/local 目录下
tar xzf prometheus-2.24.1.linux-amd64.tar.gz -C /usr/local/
3.2 给目录创建软链接
ln -s /usr/local/prometheus-2.24.1.linux-amd64/ /usr/local/prometheus
3.3 切换到目录下
3.4 修改配置文件 prometheus.yml,配置要监控的项
scrape_configs:
 # The job name is added as a label `job=<job_name>` to any timeseries scraped from this config.
 - job_name: 'prometheus'

 # metrics_path defaults to '/metrics'
 # scheme defaults to 'http'.

 static_configs:
 - targets: ['localhost:9090']
 #监控Linux主机状态
 - job_name: 'linux'
 static_configs:
 - targets: ['192.168.153.138:9100']
 #监控mysql服务状态
 - job_name: 'mysql'
 static_configs:
 - targets: ['192.168.153.138:9104']
3.5 启动promethus服务
./prometheus --config.file=prometheus.yml
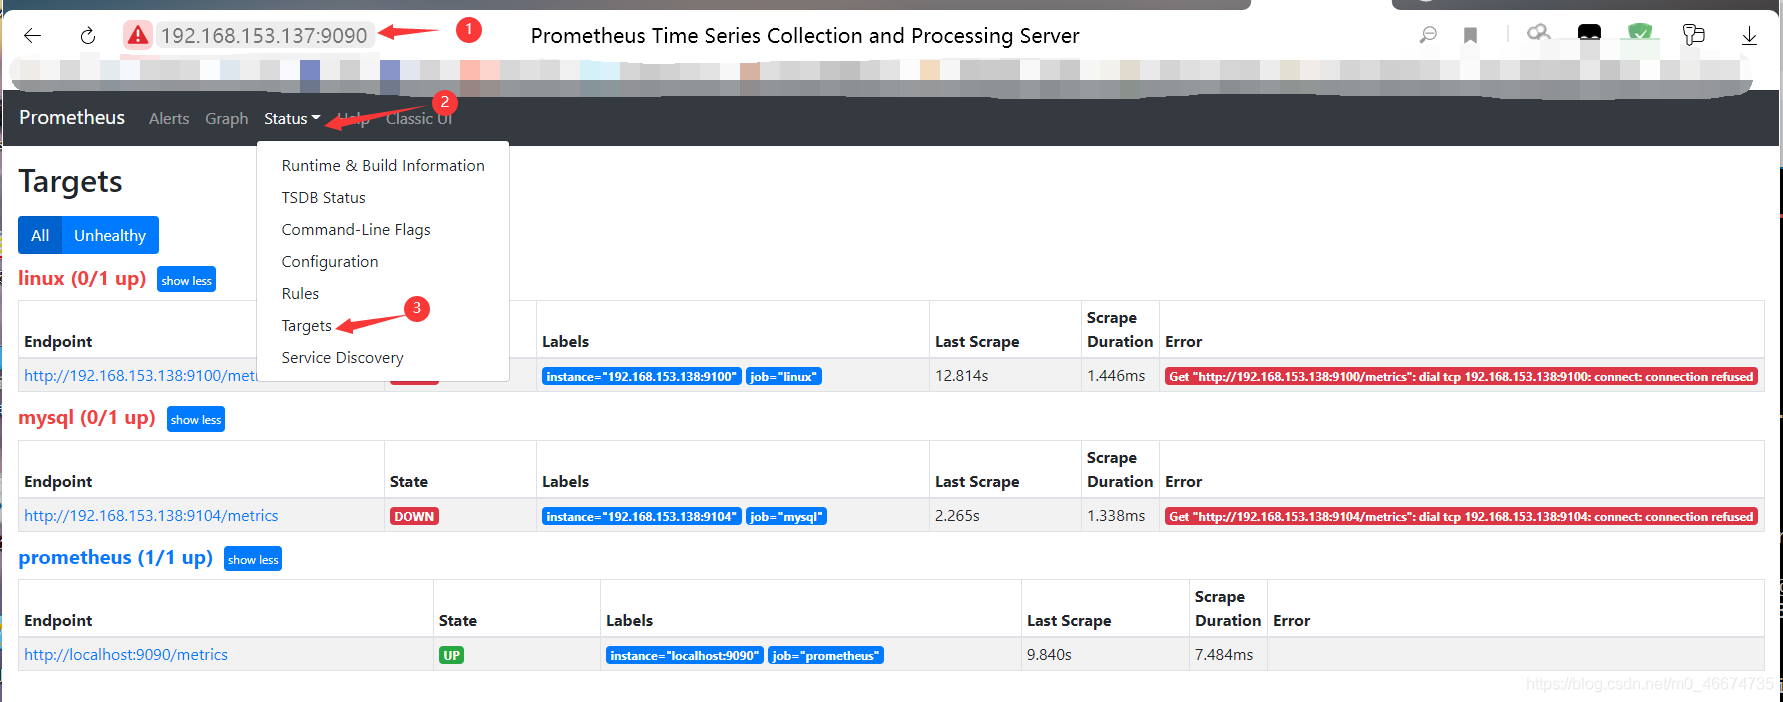
3.6 浏览器输入 IP:9090 查看
在Status->Targets页面下,我们可以看到我们配置的两个Target,它们的State为DOWN。
4. 配置138主机 4.1 下载exporter
下载地址>> https://github.com/prometheus/node_exporter/releases
4.2 将软件包解压到 /usr/local 目录下
tar xzf node_exporter-1.0.1.linux-amd64.tar.gz -C /usr/local/
4.3 启动exporter
nohup /usr/local/node_exporter-1.0.1.linux-amd64/node_exporter &
4.4 下载mysqld_exporter
下载地址>> https://github.com/prometheus/mysqld_exporter/releases
4.5 将软件包解压到 /usr/local 目录下
tar xzf mysqld_exporter-0.12.1.linux-amd64.tar.gz -C /usr/local/
4.6 数据库给mysqld_exporter授权
[root@host-138 ~]# mysql
Welcome to the MariaDB monitor. Commands end with ; or \g.

MariaDB [(none)]> GRANT REPLICATION CLIENT,PROCESS ON *.* TO 'mysql_monitor'@'localhost' identified by 'mysql_monitor';
Query OK, 0 rows affected (0.00 sec)

MariaDB [(none)]> GRANT SELECT ON *.* TO 'mysql_monitor'@'localhost';
Query OK, 0 rows affected (0.00 sec)
4.7 创建 .my.cnf 配置文件
vim /usr/local/mysqld_exporter-0.12.1.linux-amd64/.my.cnf
内容为:
[client]
user=mysql_monitor
password=mysql_monitor
4.8 运行mysqld_exporter服务
nohup /usr/local/mysqld_exporter-0.12.1.linux-amd64/mysqld_exporter --config.my-cnf="/usr/local/mysqld_exporter-0.12.1.linux-amd64/.my.cnf" &
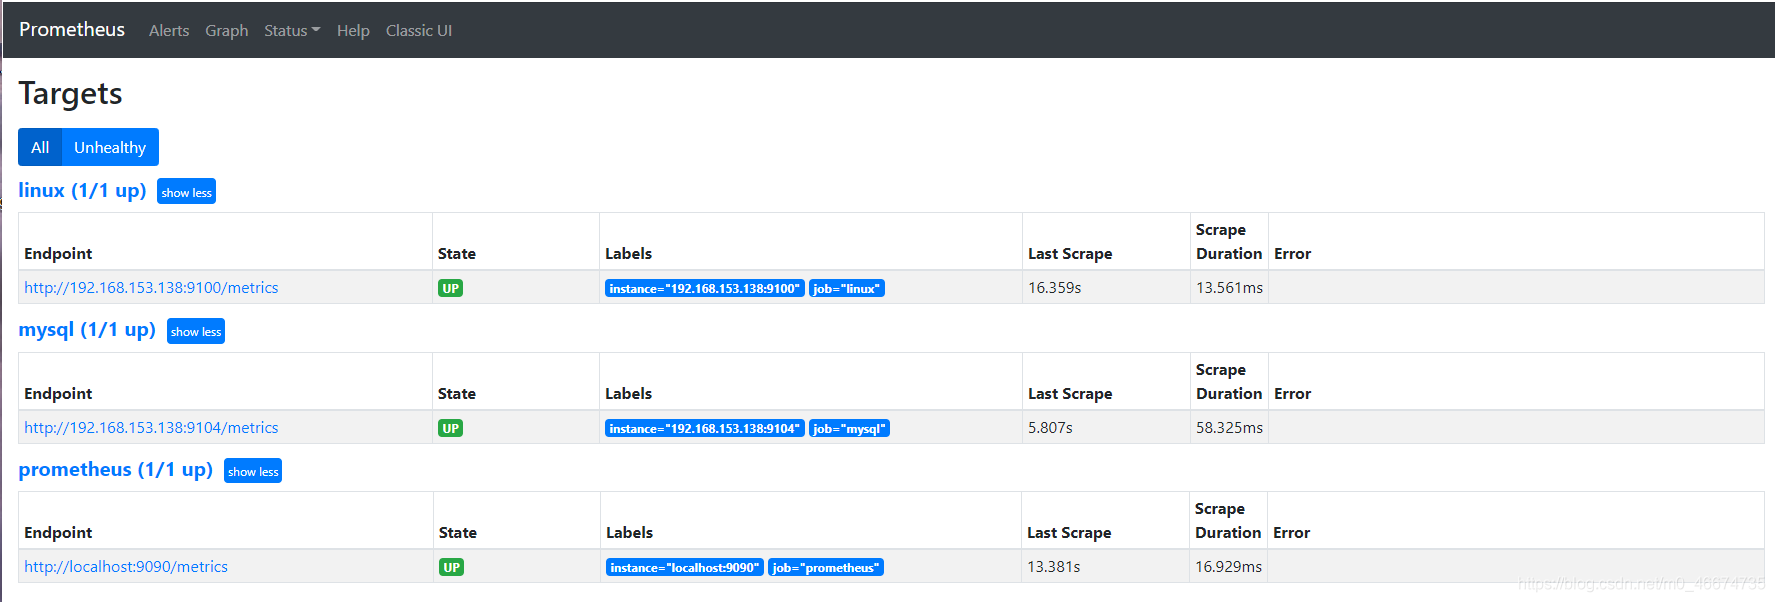
5. 在promethus页面刷新Status->Targets页面,可以看到配置的两个Target的State为UP:
5. 在137主机上安装部署grafana
安装教程链接>>http://blog.iis7.com/article/204660.htm
5.1 添加promethus数据源 未完待续…
jsjbwy