#@这个示例使用 vue-cli 脚手架搭建
#安装echarts依赖
npm install echarts -S
main.js 里引入(我在当前页面用了 没有用此步骤)
import echarts from ‘echarts’
Vue.prototype.$echarts = echarts
下面这代码直接复制到你想创建的页面就ok
<template>
  <div>
    66666
    <div id="myChart" :style="{width: '300px', height: '300px'}"></div>
  </div>
</template>

<script>
// 引入基本模板
let echarts = require('echarts/lib/echarts')
// 引入柱状图组件

require('echarts/lib/chart/bar')
// 引入提示框和title组件
require('echarts/lib/component/tooltip')
require('echarts/lib/component/title')
export default {
  // name: 'hello',
  data () {
    return {
      msg: 'Welcome to Your Vue.js App'
    }
  },
  mounted () {
    this.drawLine()
  },
  methods: {
    drawLine () {
      // 基于准备好的dom,初始化echarts实例
      let myChart = echarts.init(document.getElementById('myChart'))
      // 绘制图表

      myChart.setOption({
        title: { text: 'ECharts 入门示例' },
        tooltip: {},
        xAxis: {
          data: [ '衬衫', '羊毛衫', '雪纺衫', '裤子', '高跟鞋', '袜子' ]
        },
        yAxis: {},
        series: [{
          name: '销量',
          type: 'bar',
          data: [ 5, 20, 36, 10, 10, 20 ]
        }]
      })
    }
  }
}
</script>

<style lang="less" scoped></style>
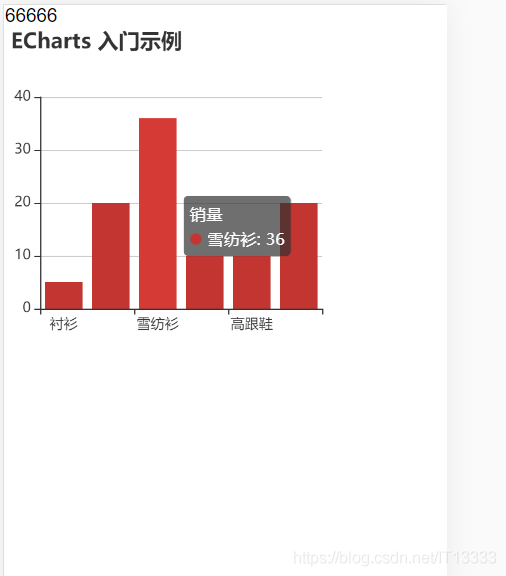
显示效果如下图
cs