filebeat使用modules收集nginx日志
1.为什么要使用modules收集日志
modules只是filebeat的一个小功能,由于像mysql、redis等这种日志无发输出成json格式,filebeat无法将收集来的普通日志转换为json格式,从而进行细致的统计
logstash可以做到将普通日志转换成json格式,但是配置十分复杂,且容易出错
介于种种不便,elk官方推出了filebeat modules模块功能,将常用服务的日志转换做成了模板,只需要启动模板,配置日志路径即可将普通文本的日志格式转换成json格式的输出
modules收集日志实现思路:
1.首先启用某个module,然后修改配置文件增加module文件路径
2.修改某个module的配置文件,明确收集什么日志
3.开启module kibana自带图形展示
2.filebeat开启modules
2.1.修改配置文件指定modules路径
指定完modules路径后不用重启即可保存
1.修改配置文件
[root@nginx02 ~]# vim /etc/filebeat/filebeat.yml
filebeat.config.modules:
  path: ${path.config}/modules.d/*.yml
  reload.enabled: false

2.查看有哪些modules   enabled:表示启用的   disabled表示关闭的
[root@nginx02 ~]# filebeat modules list
Enabled:

Disabled:
apache2
auditd
elasticsearch
haproxy
icinga
iis
kafka
kibana
logstash
mongodb
mysql
nginx
osquery
postgresql
redis
suricata
system
traefik
2.2.filebeat启用nginx module
1.启用nginx modules
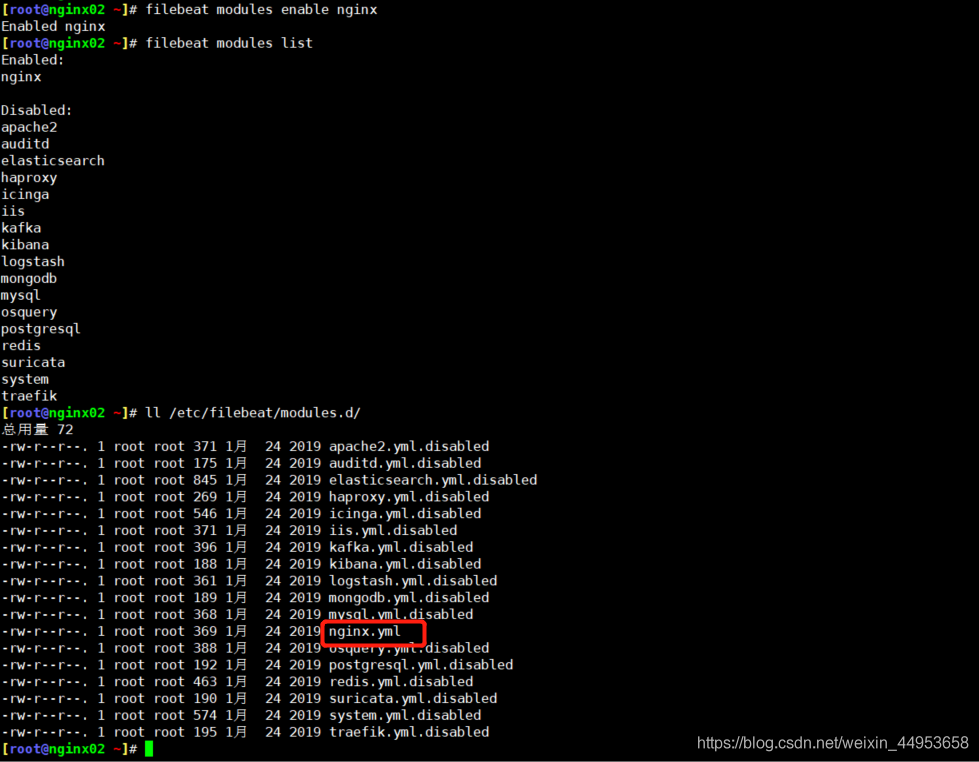
[root@nginx02 ~]# filebeat modules enable nginx
Enabled nginx
2.查看启动的modules列表
[root@nginx02 ~]# filebeat modules list
Enabled:
nginx
3.查看modules.d目录下的文件发生了什么变化,可以看到已经由.disabled改成了.yml
[root@nginx02 ~]# ll /etc/filebeat/modules.d/nginx*
-rw-r--r--. 1 root root 369 1月 24 2019 /etc/filebeat/modules.d/nginx.yml
其实 filebeat modules enable nginx就喝mv命令是一样的,给改个名字而已
2.3.配置nginx收集普通日志格式
[root@nginx02 ~]# vim /etc/nginx/nginx.conf
log_format  main  '$remote_addr - $remote_user [$time_local] "$request" '
                      '$status $body_bytes_sent "$http_referer" '
                      '"$http_user_agent" "$http_x_forwarded_for"';

[root@nginx02 ~]# systemctl reload nginx

[root@nginx02 ~]# tail -f /var/log/nginx/www_access.log
192.168.81.210 - - [21/Jan/2021:15:46:49 +0800] "GET / HTTP/1.1" 200 10 "-" "curl/7.29.0" "-"
2.4.在es集群激活nginx module
所有es节点都要操作
1.安装插件
/usr/share/elasticsearch/bin/elasticsearch-plugin install  file:///root/ingest-user-agent-6.6.0.zip
-> Downloading file:///root/ingest-user-agent-6.6.0.zip
[=================================================] 100%
-> Installed ingest-user-agent


/usr/share/elasticsearch/bin/elasticsearch-plugin install  file:///root/ingest-geoip-6.6.0.zip
-> Downloading file:///root/ingest-geoip-6.6.0.zip
[=================================================] 100%
@@@@@@@@@@@@@@@@@@@@@@@@@@@@@@@@@@@@@@@@@@@@@@@@@@@@@@@@@@@
@     WARNING: plugin requires additional permissions     @
@@@@@@@@@@@@@@@@@@@@@@@@@@@@@@@@@@@@@@@@@@@@@@@@@@@@@@@@@@@
* java.lang.RuntimePermission accessDeclaredMembers
* java.lang.reflect.ReflectPermission suppressAccessChecks
See http://docs.oracle.com/javase/8/docs/technotes/guides/security/permissions.html
for descriptions of what these permissions allow and the associated risks.

Continue with installation? [y/N]y
-> Installed ingest-geoip

2.重启es
systemctl restart elasticsearch
es插件操作扩展
3.es插件扩展
3.1.查看插件列表
[root@elasticsearch ~]# /usr/share/elasticsearch/bin/elasticsearch-plugin list
ik
ingest-geoip
ingest-user-agent

3.2.删除一个插件
[root@elasticsearch ~]# /usr/share/elasticsearch/bin/elasticsearch-plugin remove  ingest-user-agent
-> removing [ingest-user-agent]...
2.5.配置nginx module配置文件收集nginx日志
module会将收集来的nginx日志进行格式转换,最终转换成json格式的日志
官网配置解释地址:https://www.elastic.co/guide/en/beats/filebeat/6.6/filebeat-module-nginx.html
1.修改配置文件
[root@nginx02 ~]# vim /etc/filebeat/modules.d/nginx.yml
- module: nginx
  # Access logs
  access:
    enabled: true

    # Set custom paths for the log files. If left empty,
    # Filebeat will choose the paths depending on your OS.
    var.paths: ["/var/log/nginx/www_access.log"]

  # Error logs
  error:
    enabled: true

2.重启filebeat
[root@nginx02 ~]# systemctl restart filebeat
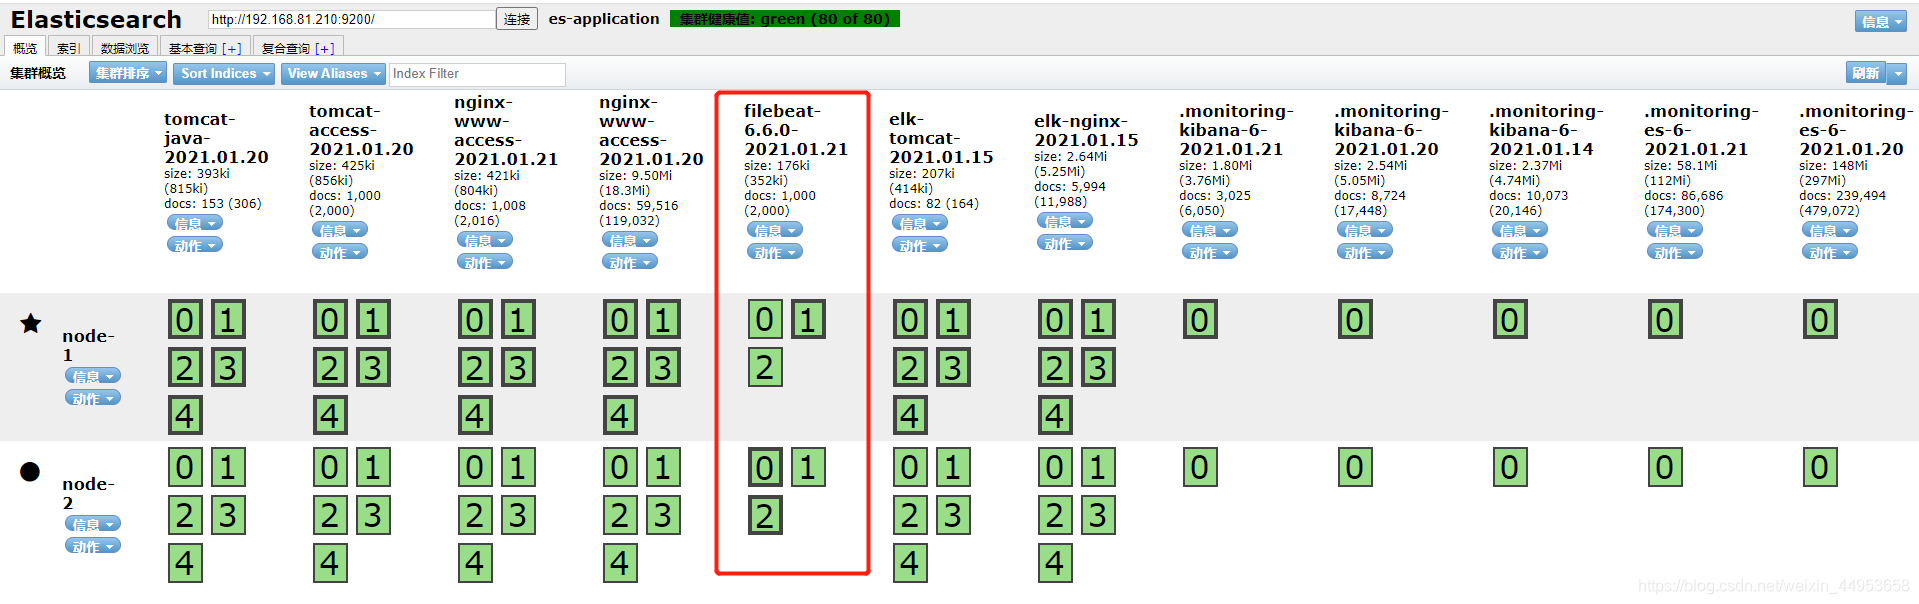
2.6.查看es上索引数据
由于我们没有指定索引名,因此是默认的filebeat-xxx
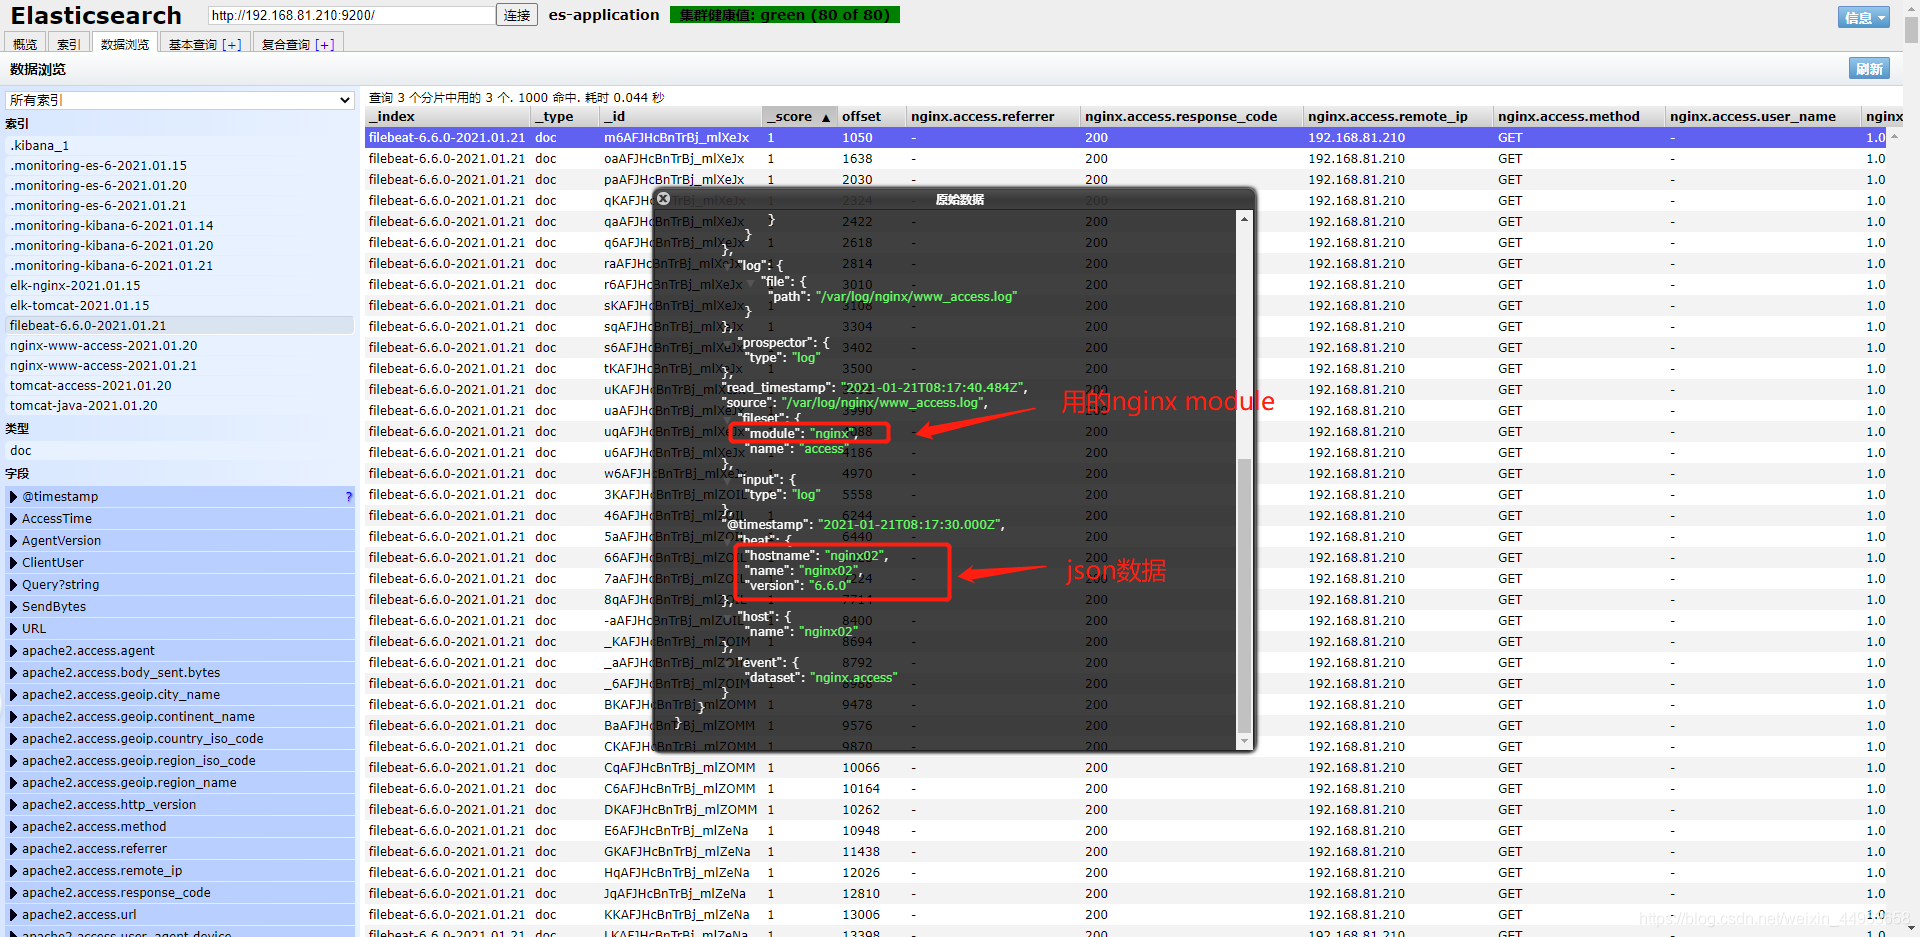
查看数据,确实都是json格式
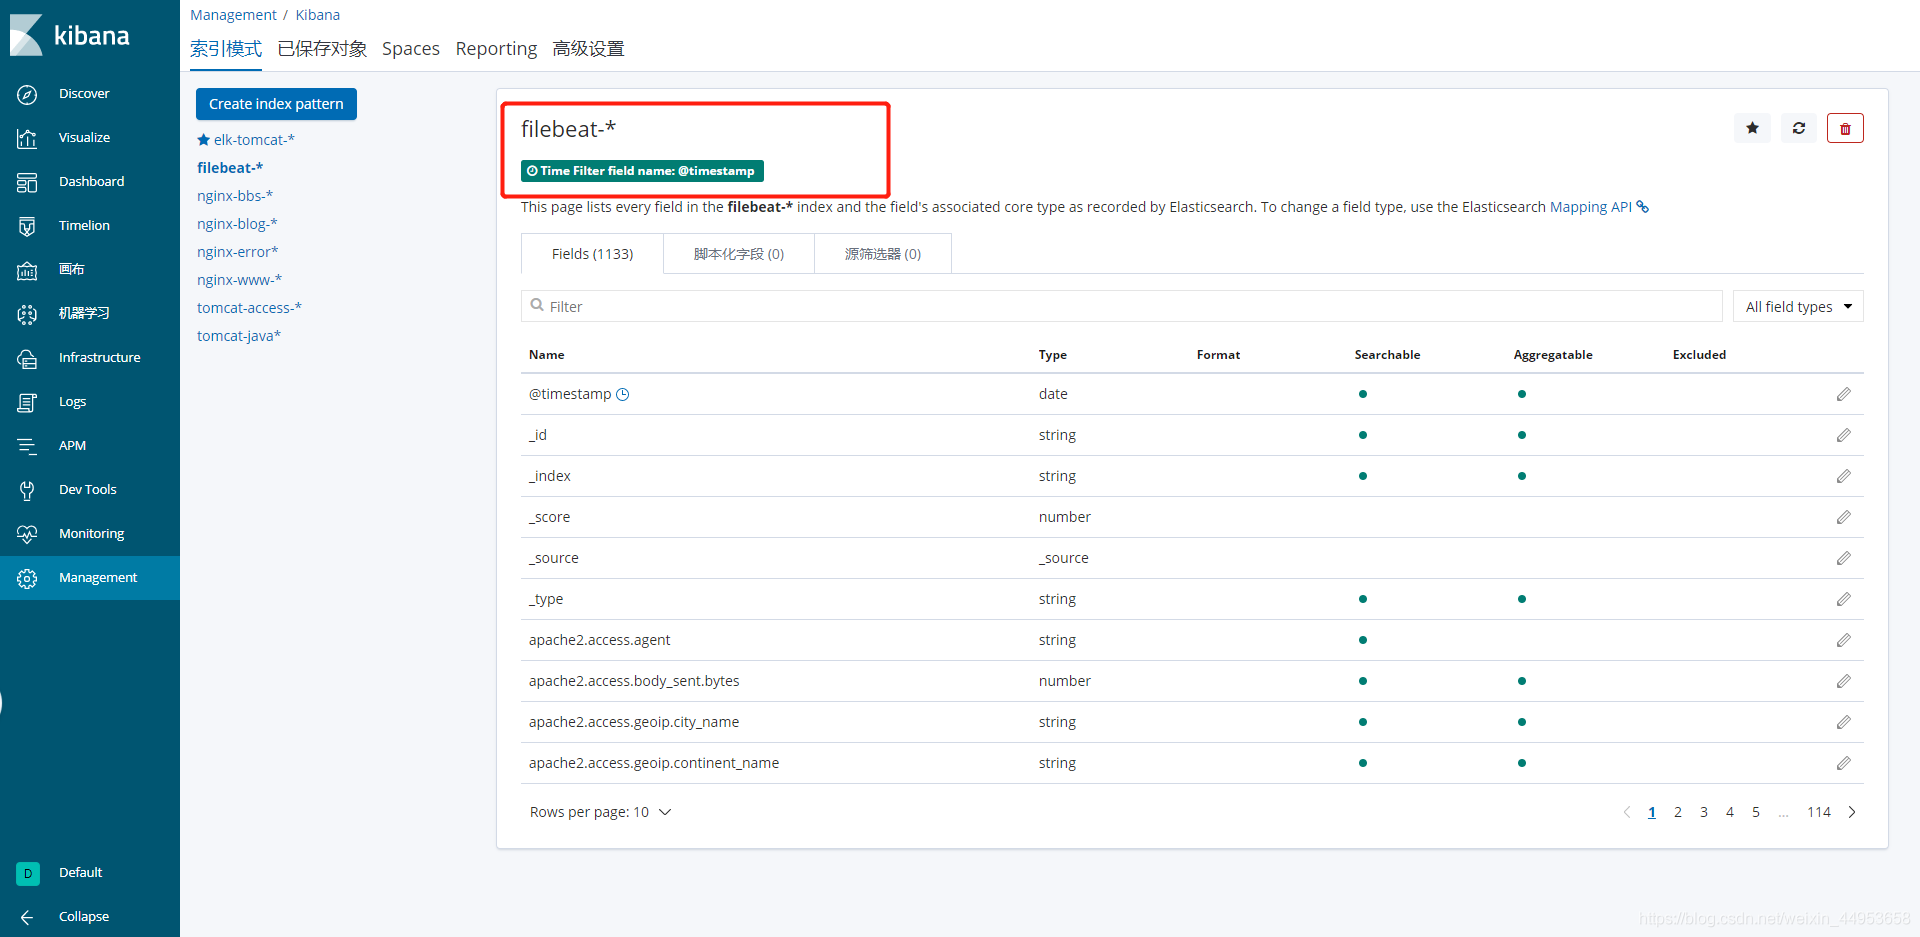
2.7.在kibana上关联es索引库
点击Managerment―索引模式―创建索引
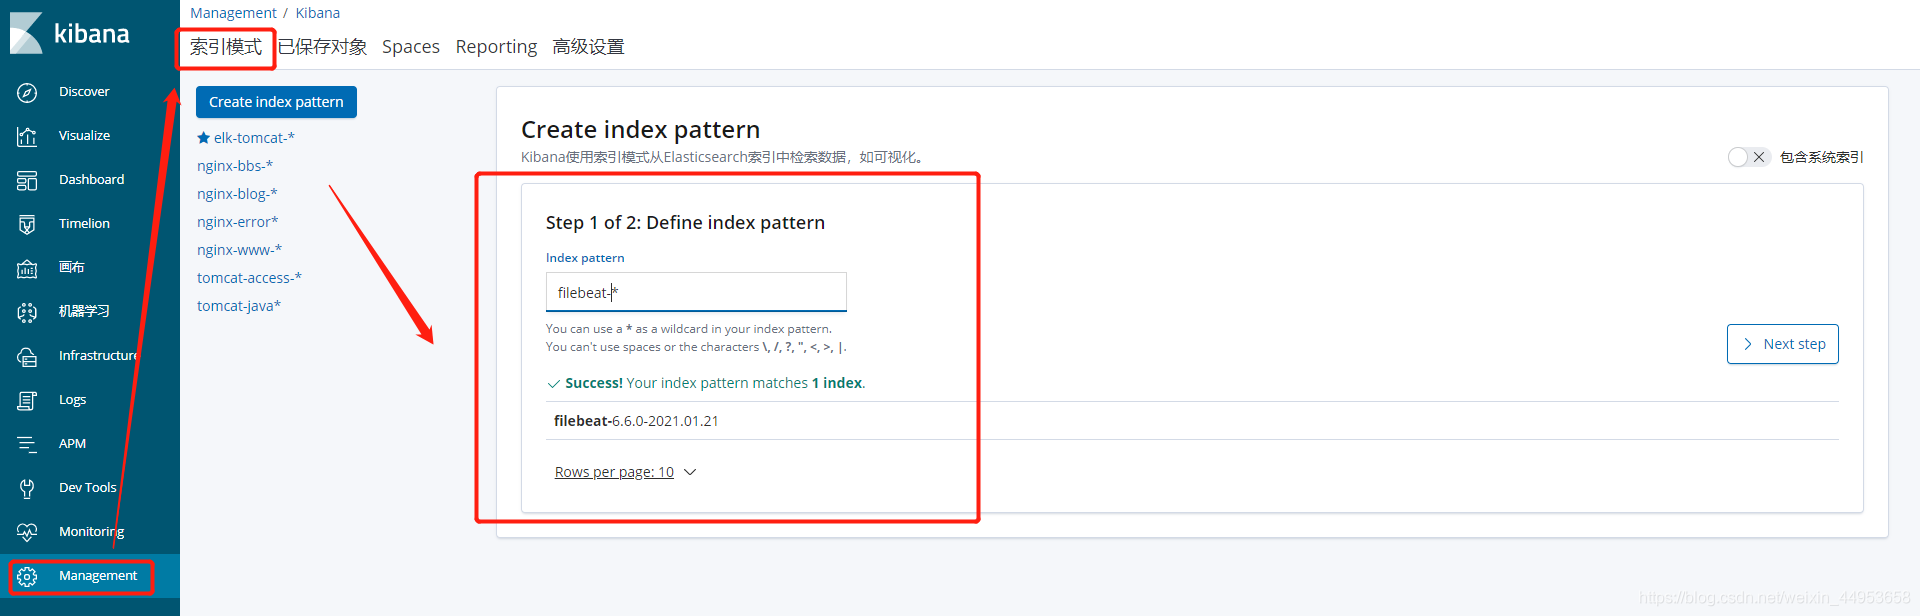
创建成功
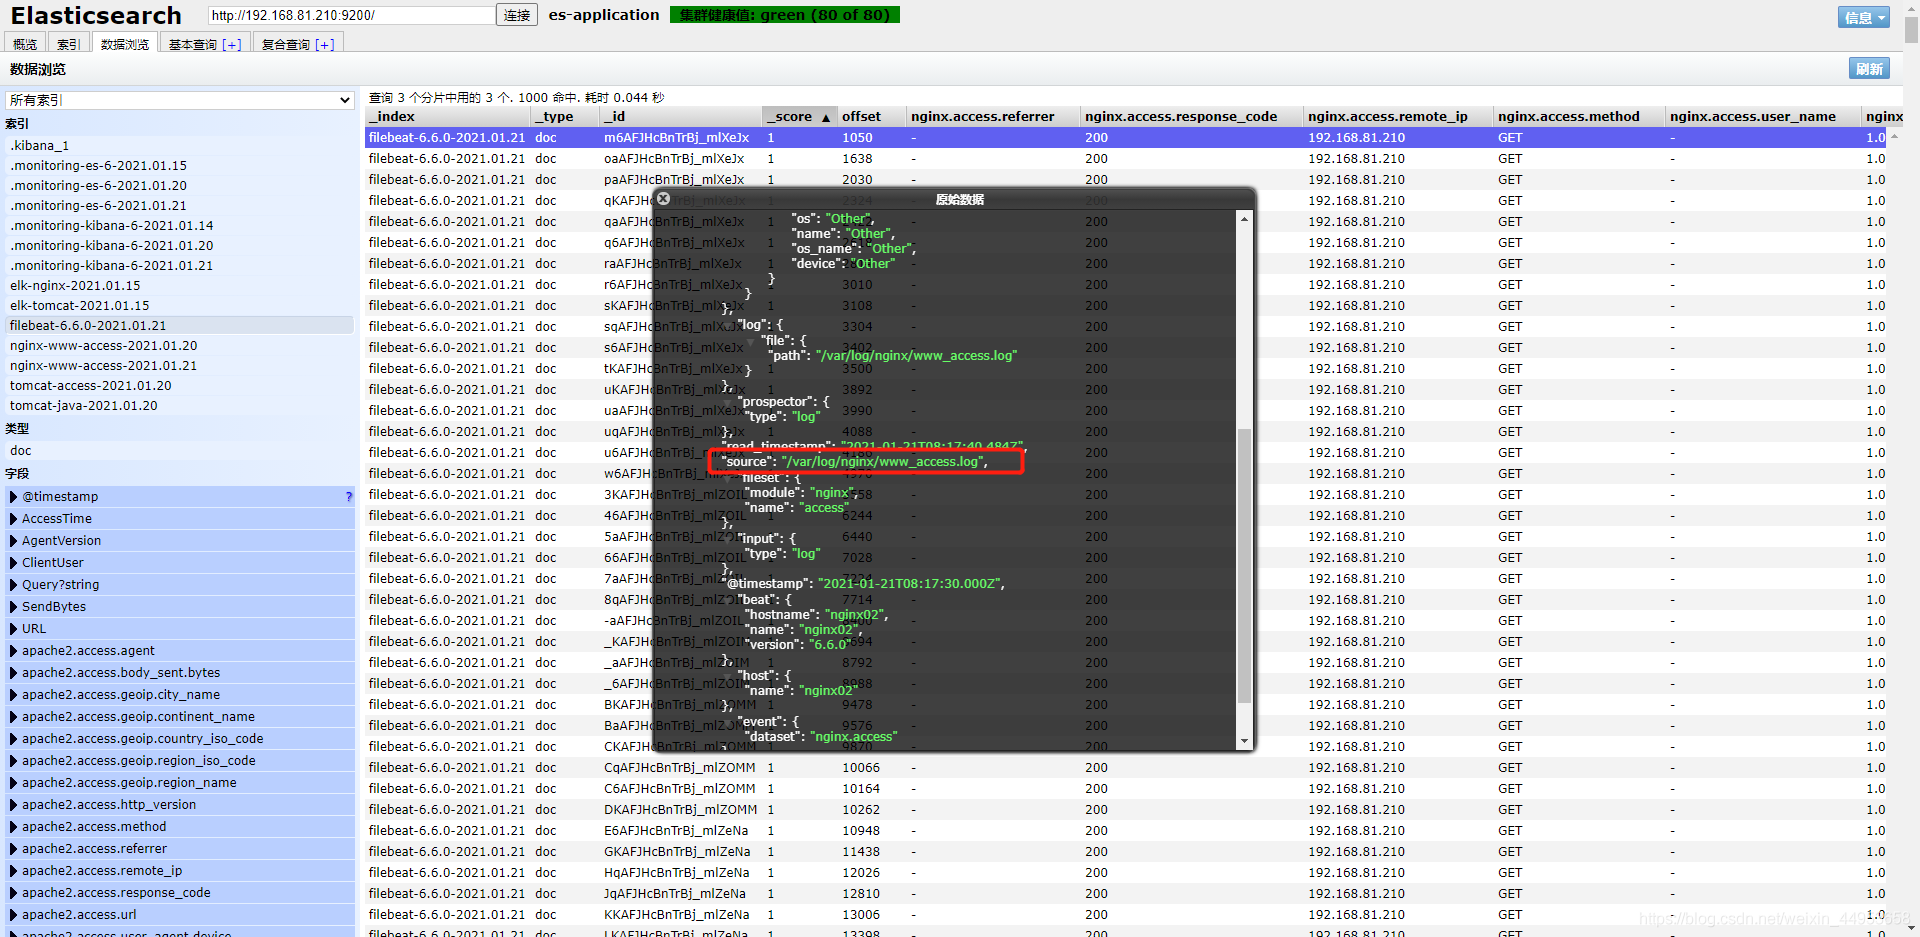
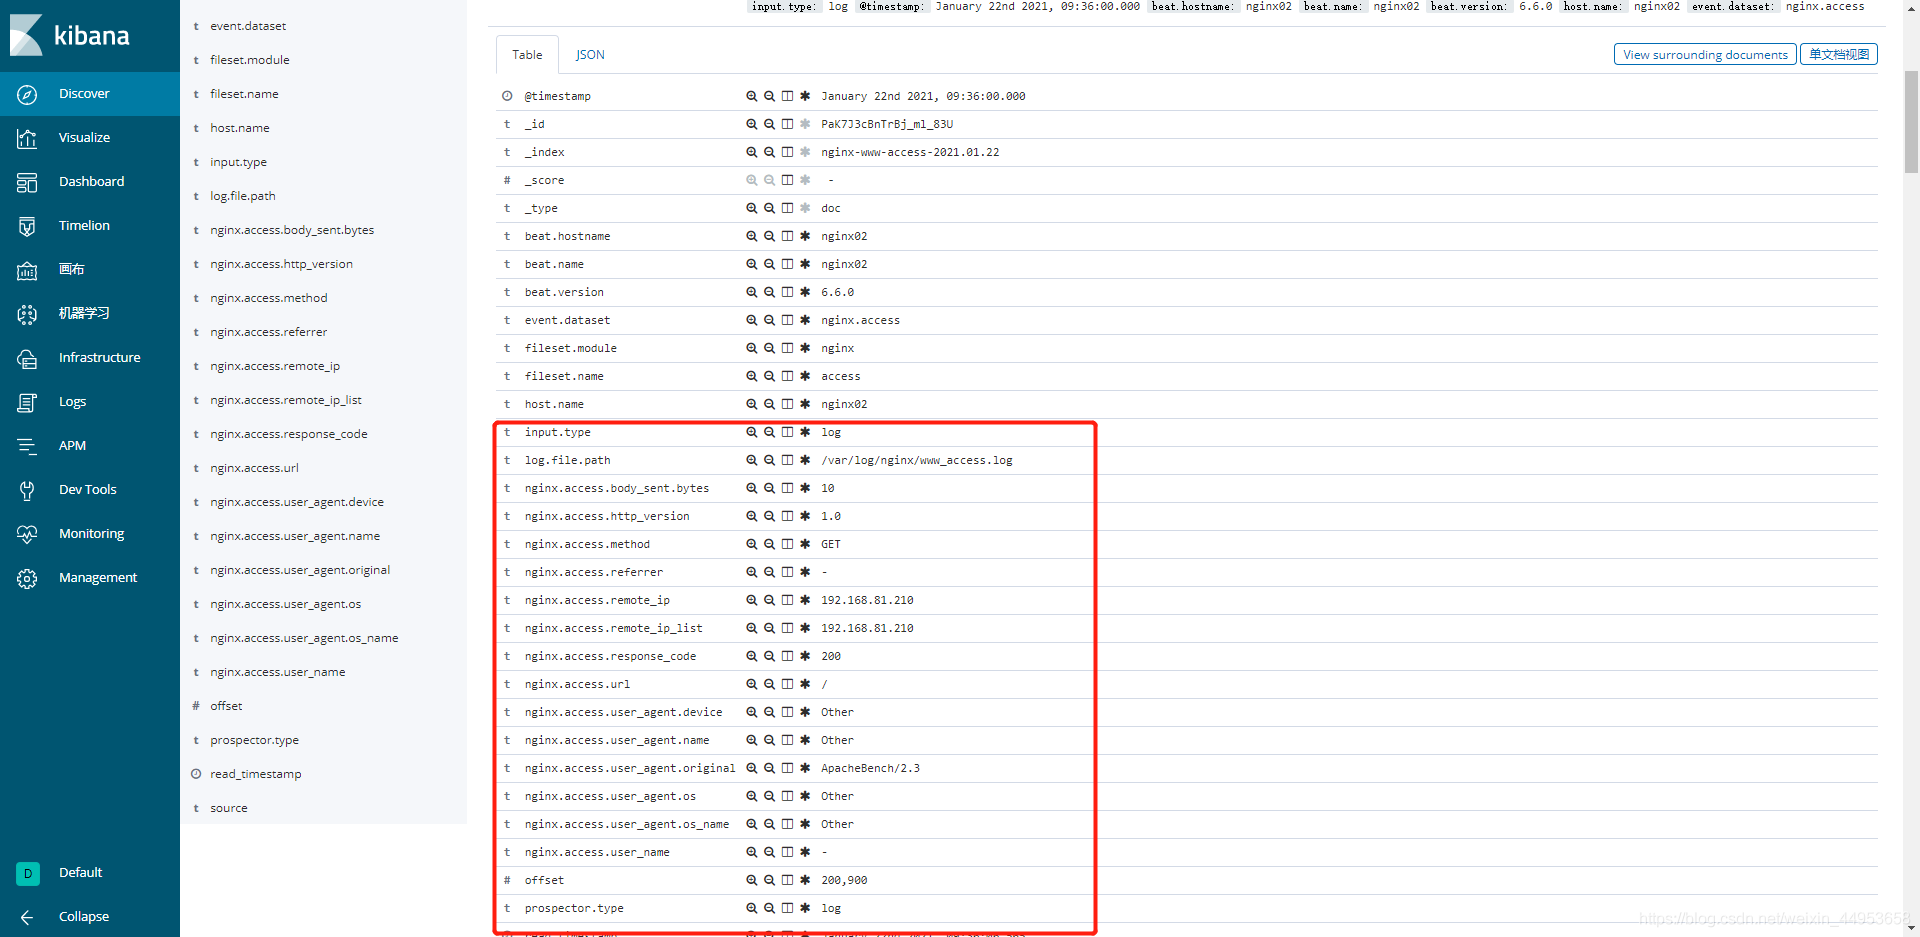
2.8.在kibana查看收集来的日志是否是json格式
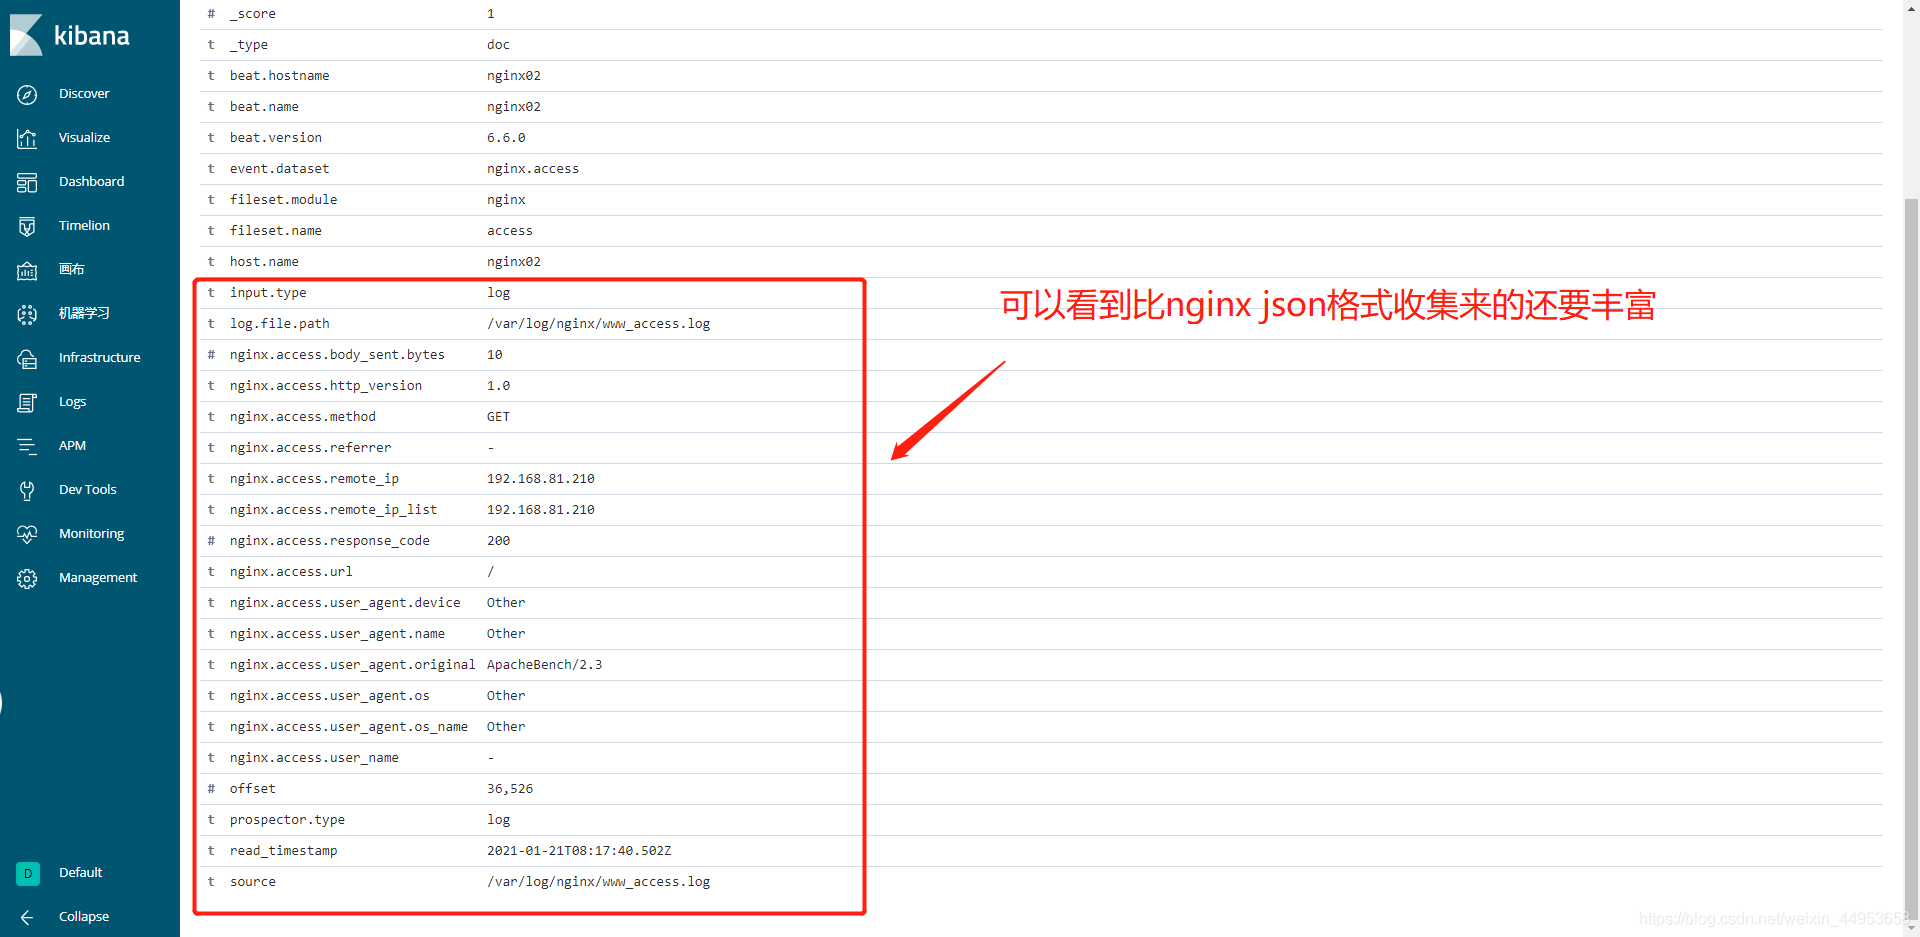
点击Discovery―选择索引,点击单文档视图即可看到详细的json格式
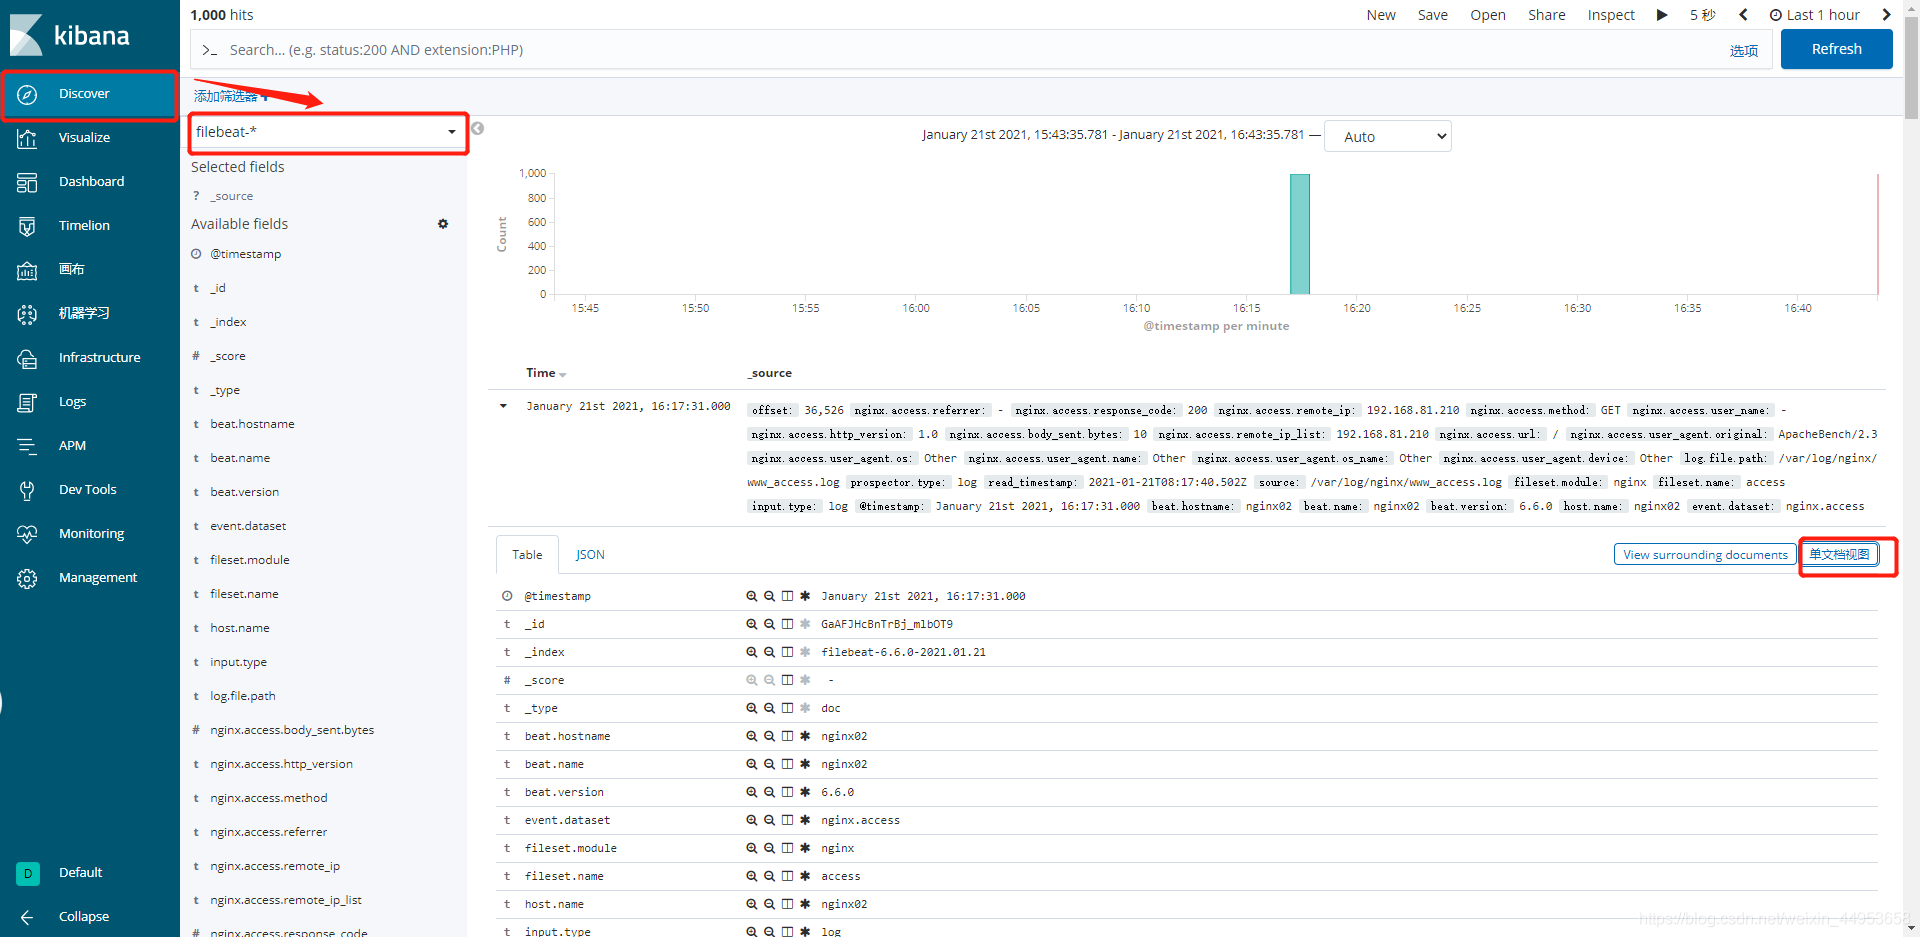
module收集来的json格式非常详细,就连filebeat的一些json都收集过来了
2.9.nginx module开启kibana图形展示
filebeat的每个module都有自己丰富的图形展现页面,只需要开启即可享受
2.9.1.配置filebeat连接kibana
1.配置filebeat连接kibana
[root@nginx02 ~]# vim /etc/filebeat/filebeat.yml
setup.kibana:
host: "192.168.81.210:5601"
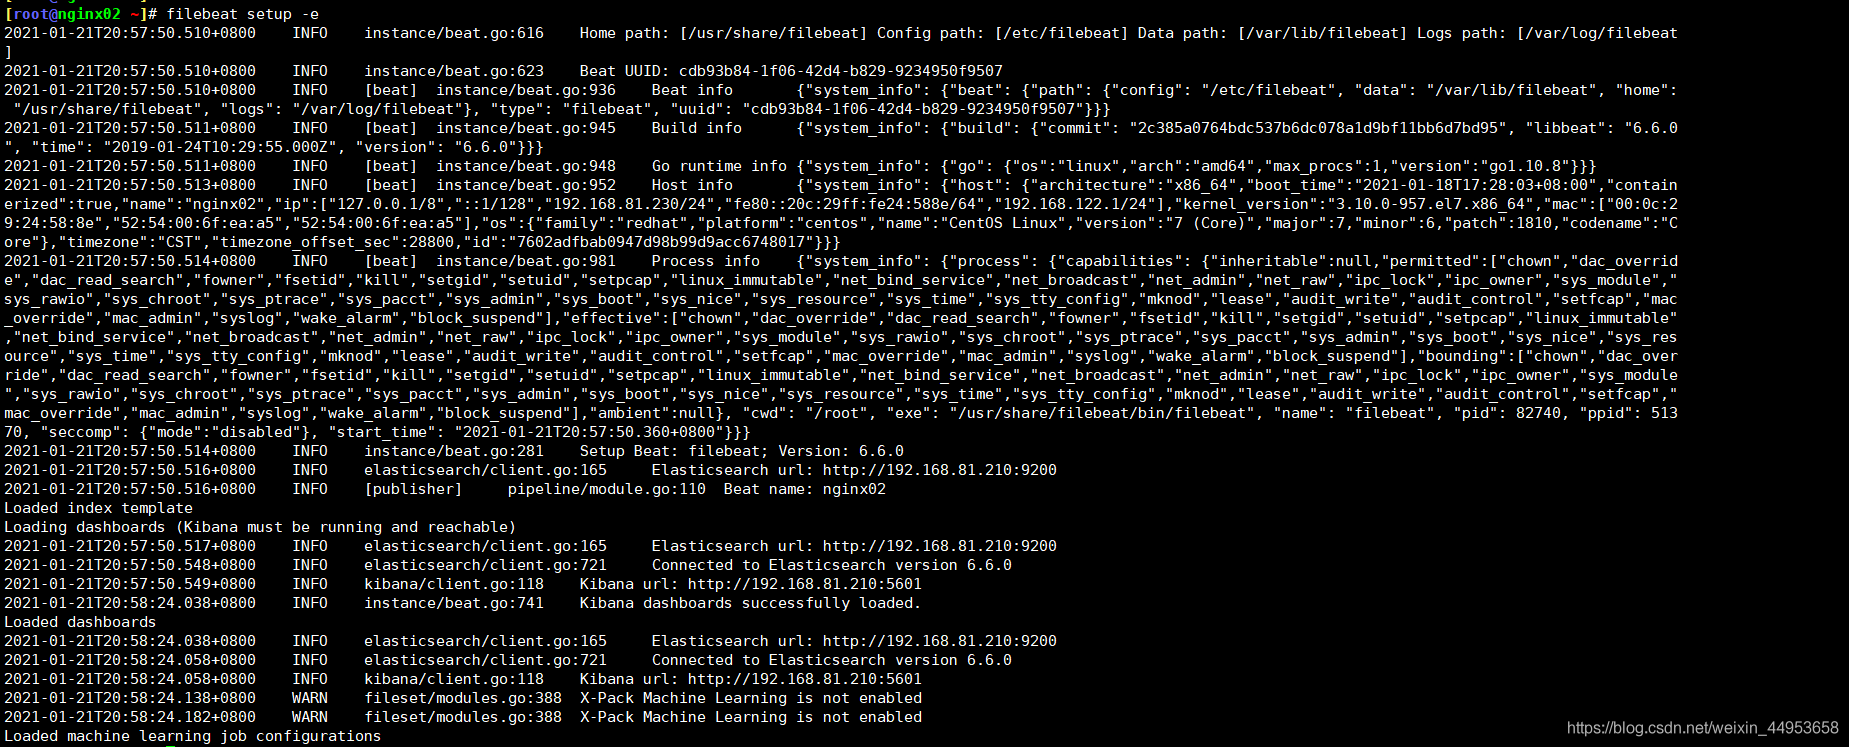
2.开启图形展示
[root@nginx02 ~]# filebeat setup -e
2.9.2.在kibana上查看图形
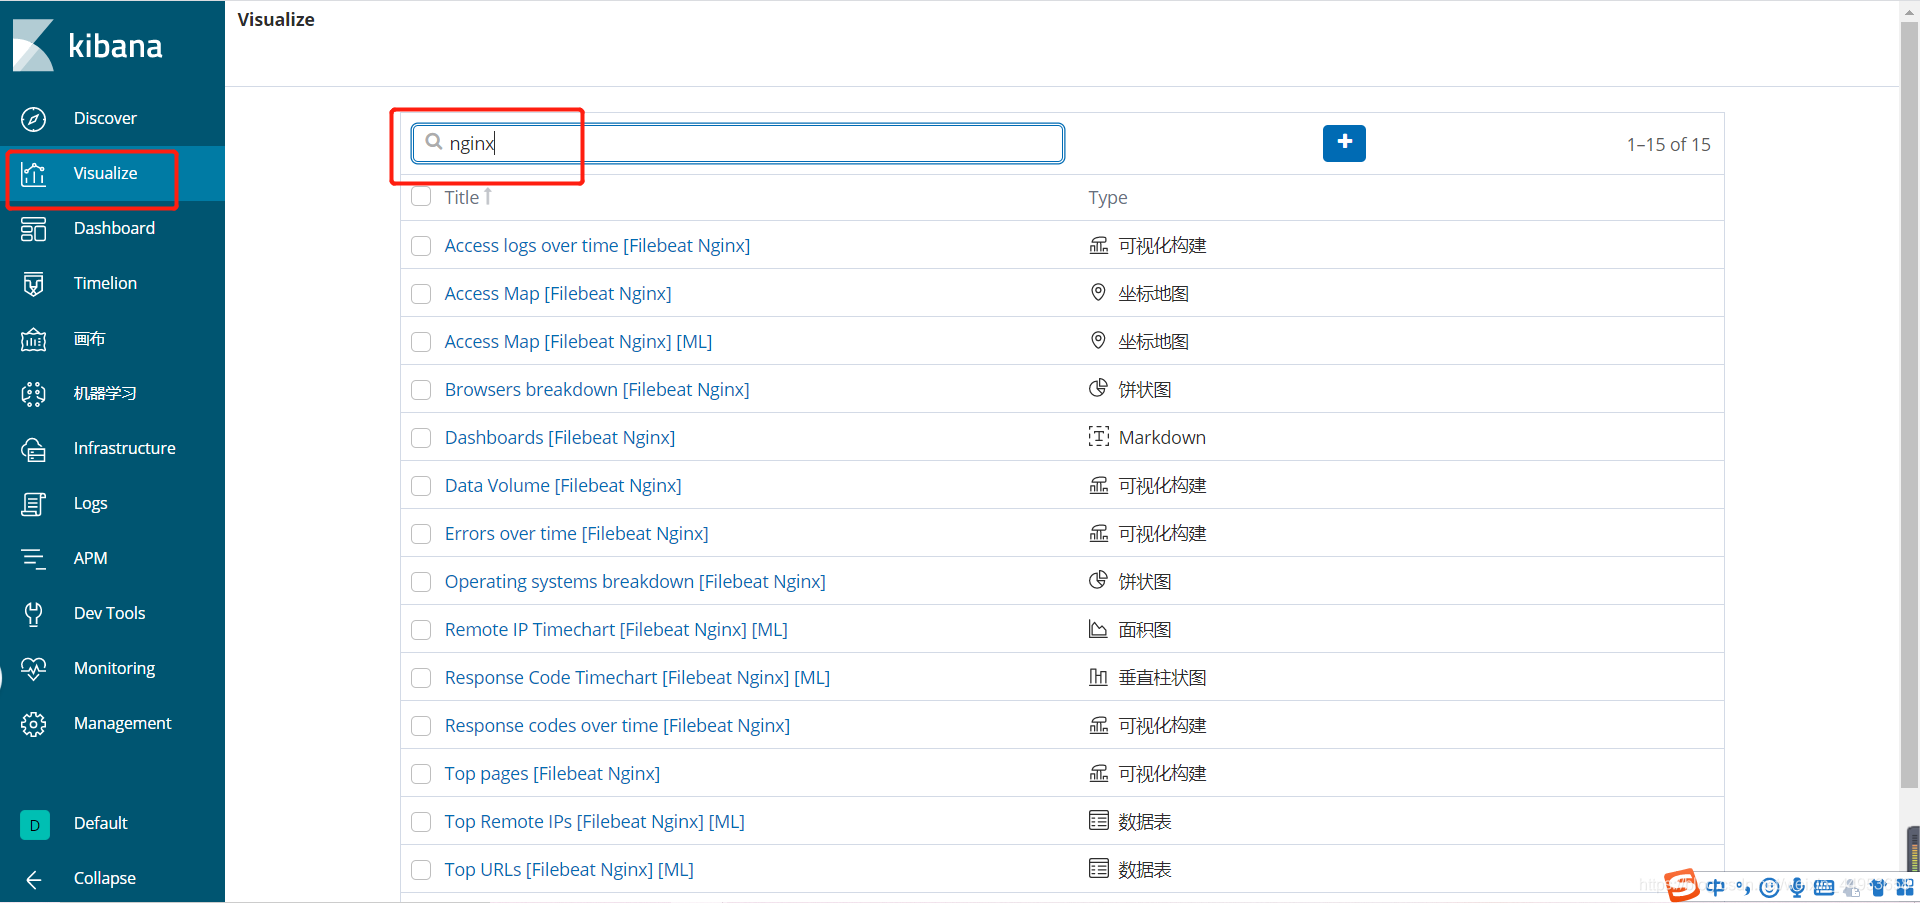
点击Visualize―搜索要查看的图形,我们搜索nginx
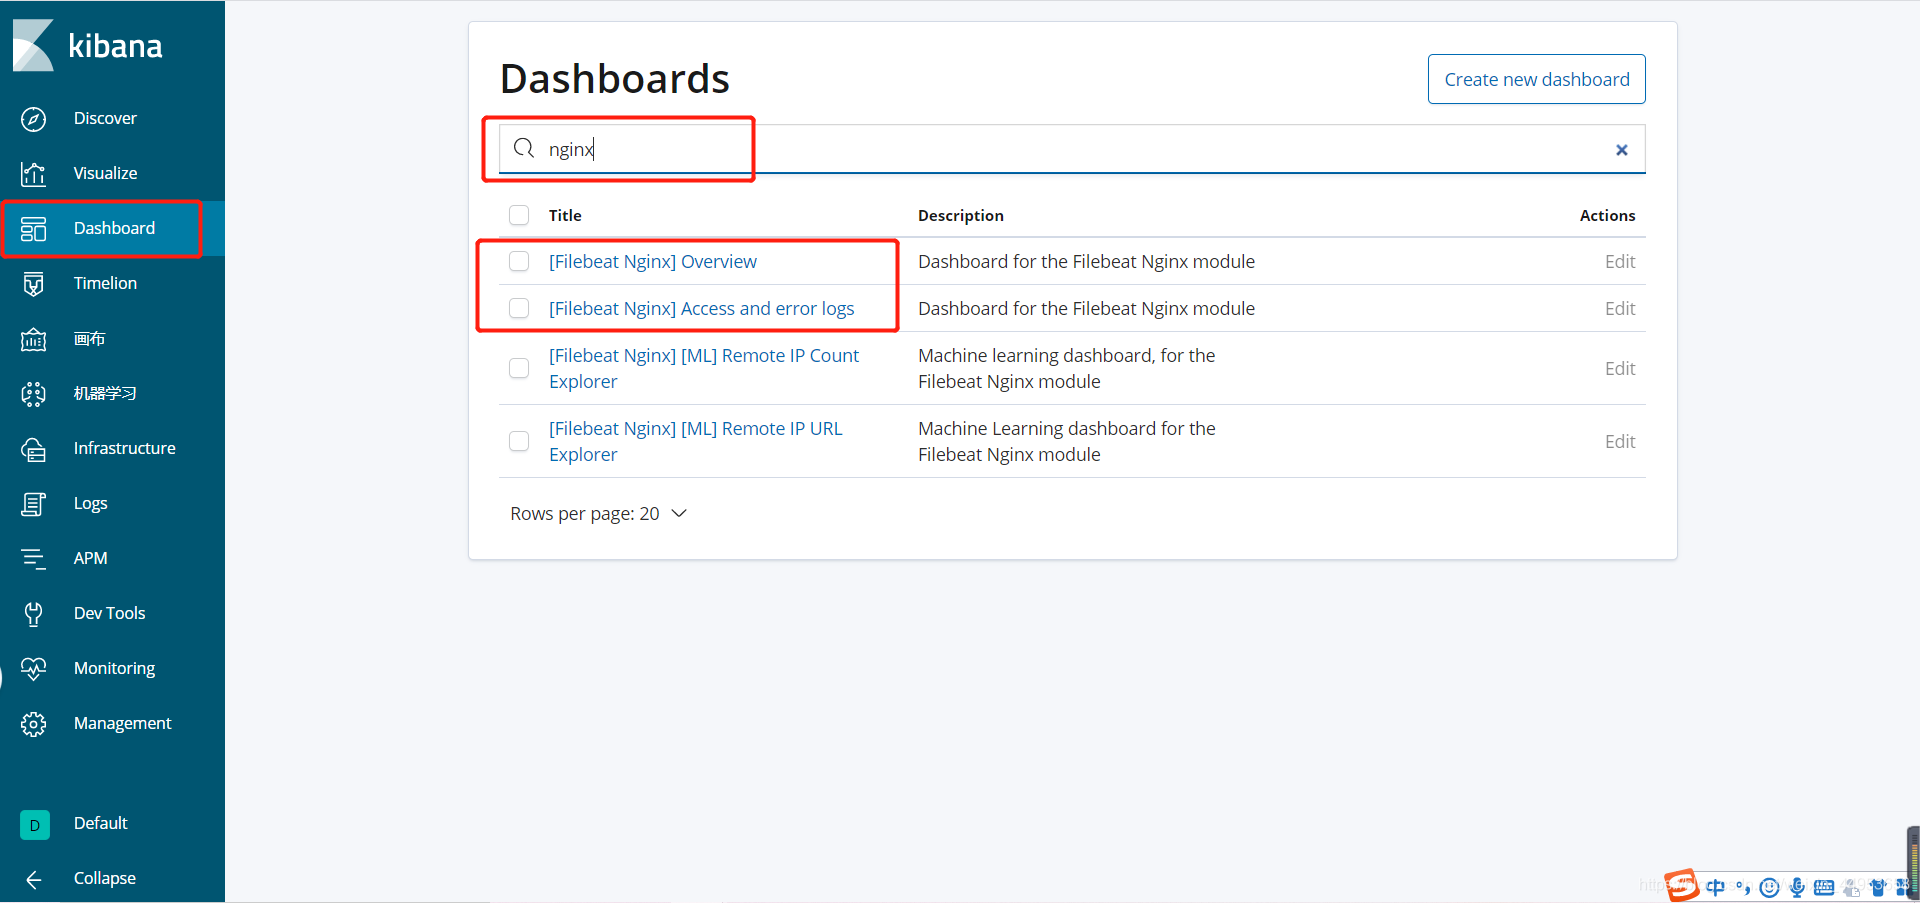
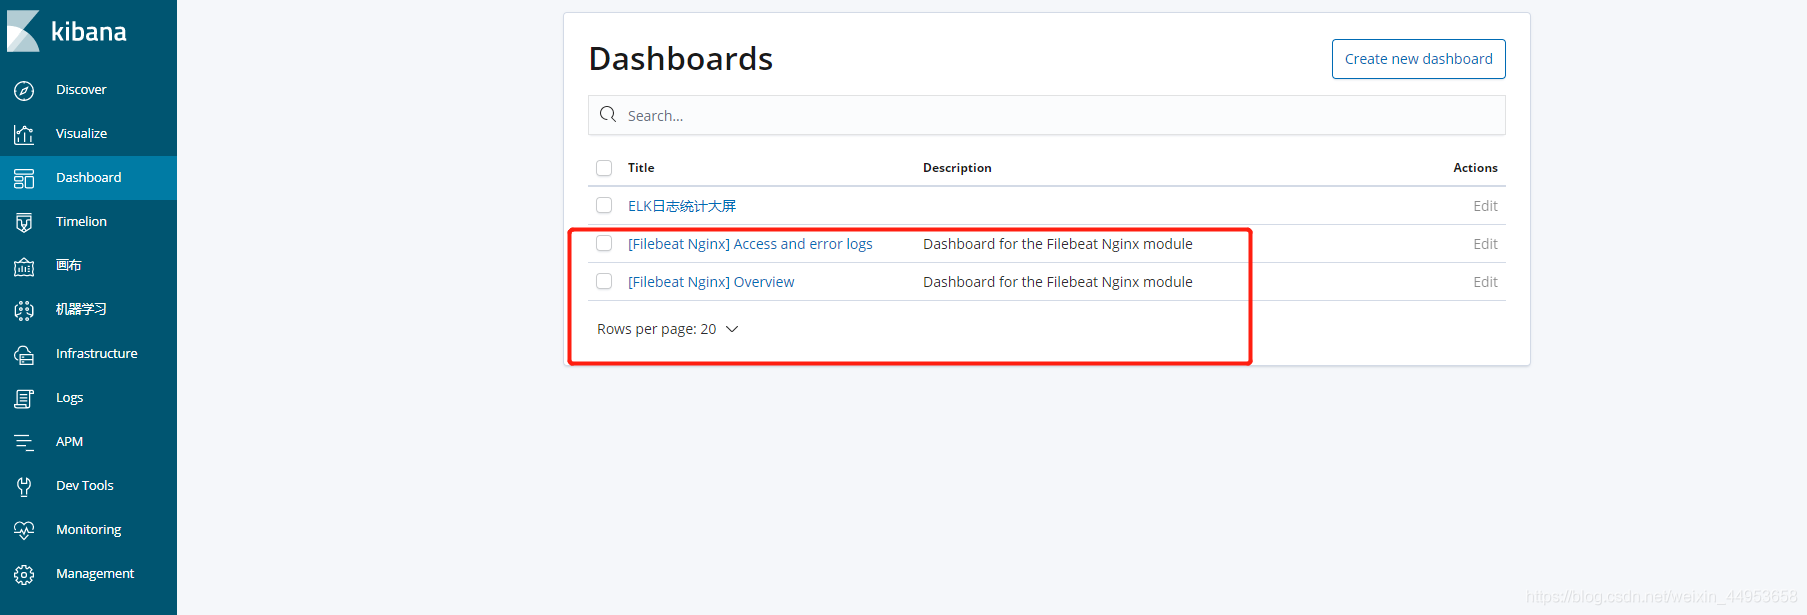
2.9.3.点击Dashboard查看图形聚合
点击Dashboard―搜索nginx,Overview和access and error都是不错的图形,画图也可以依据这里面的图形进行研究
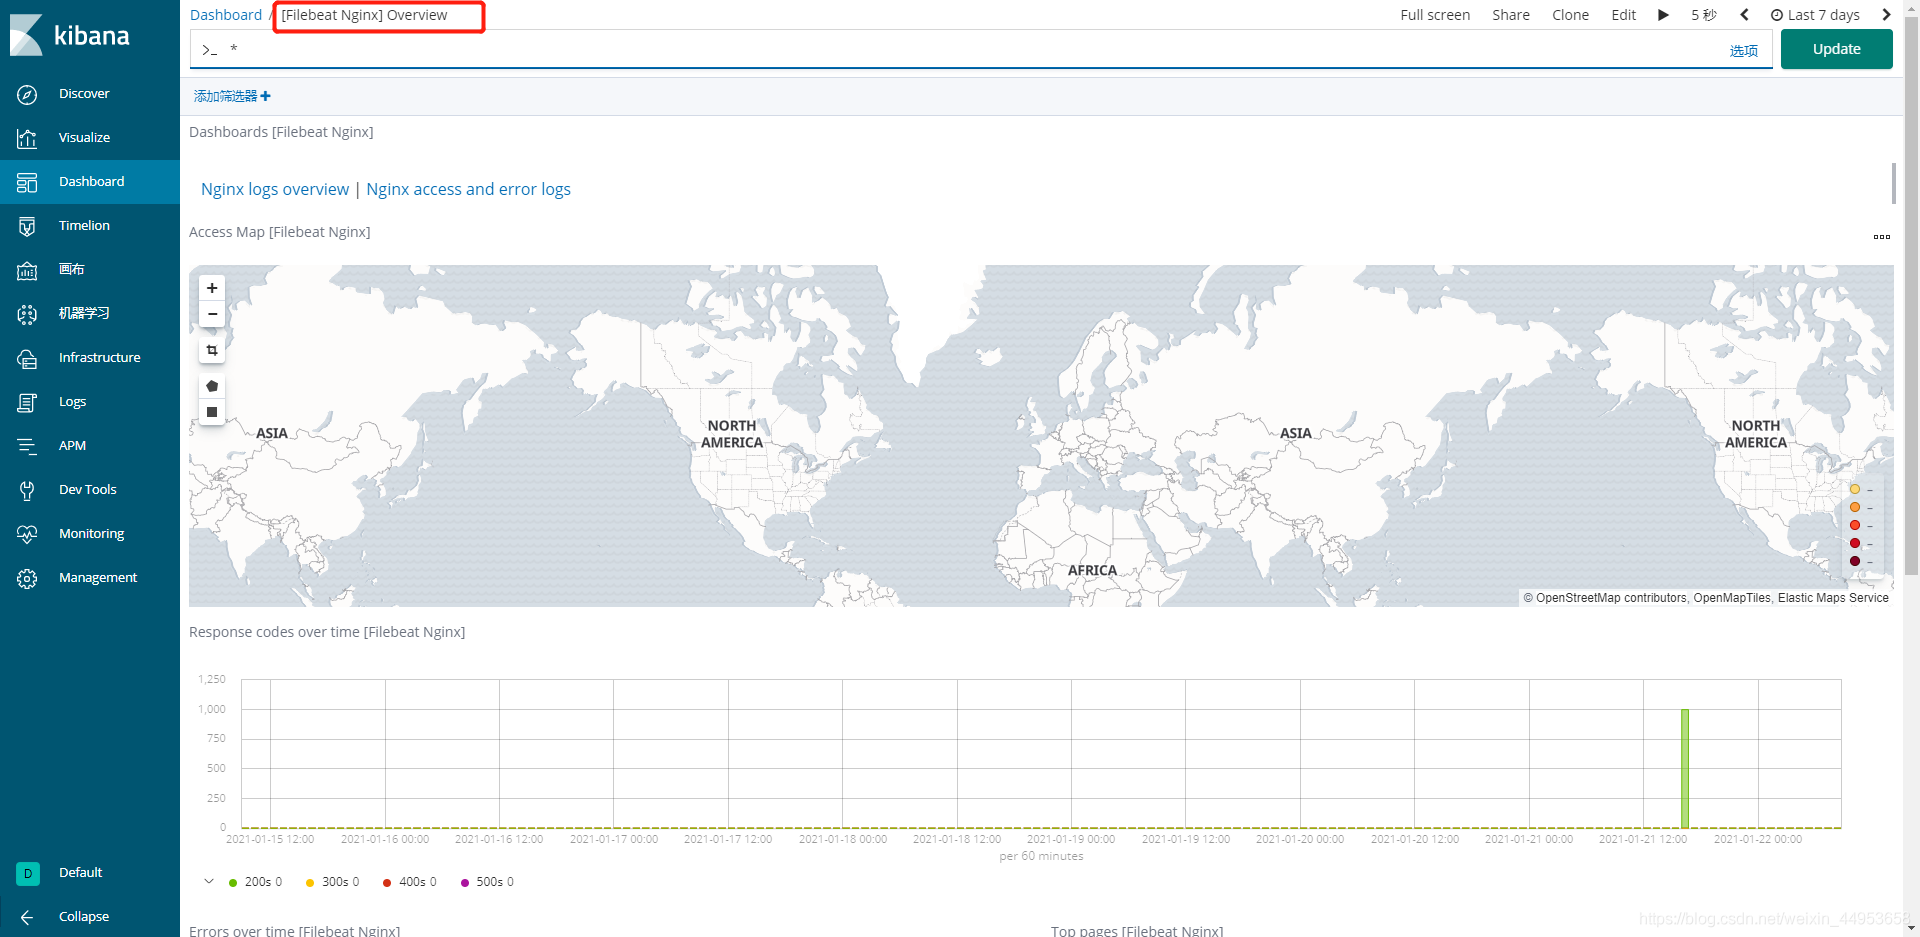
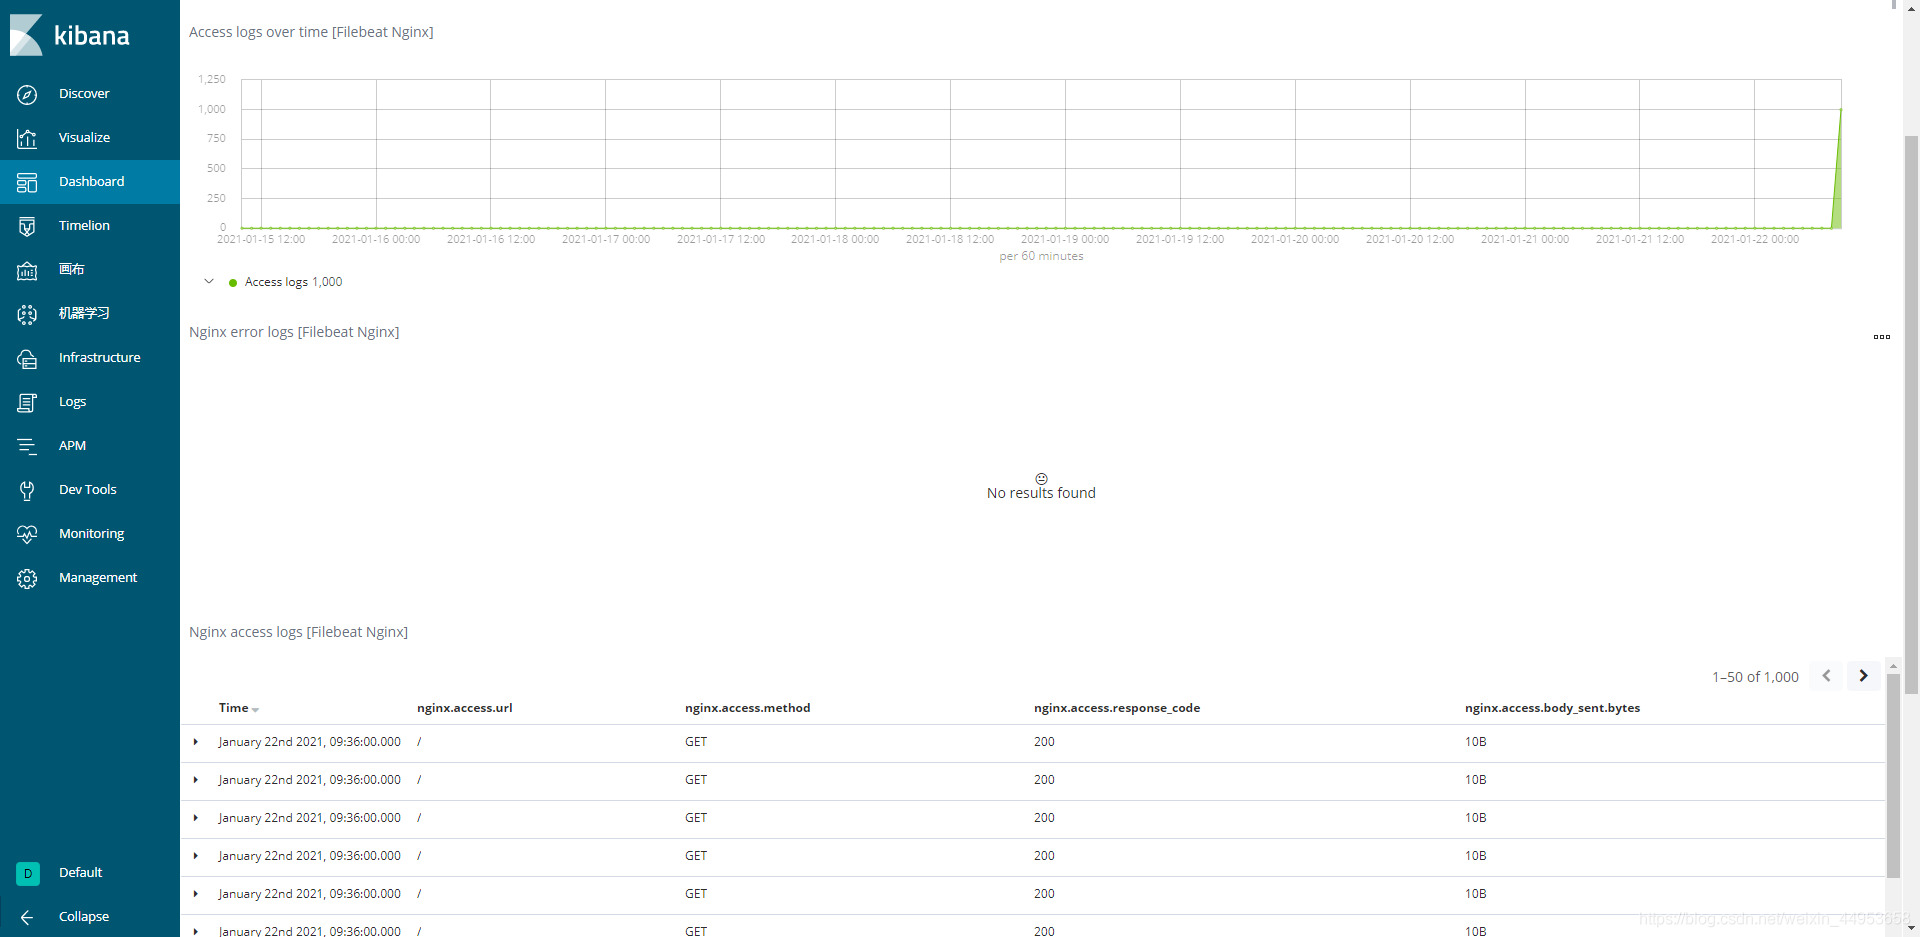
Overview仪表盘
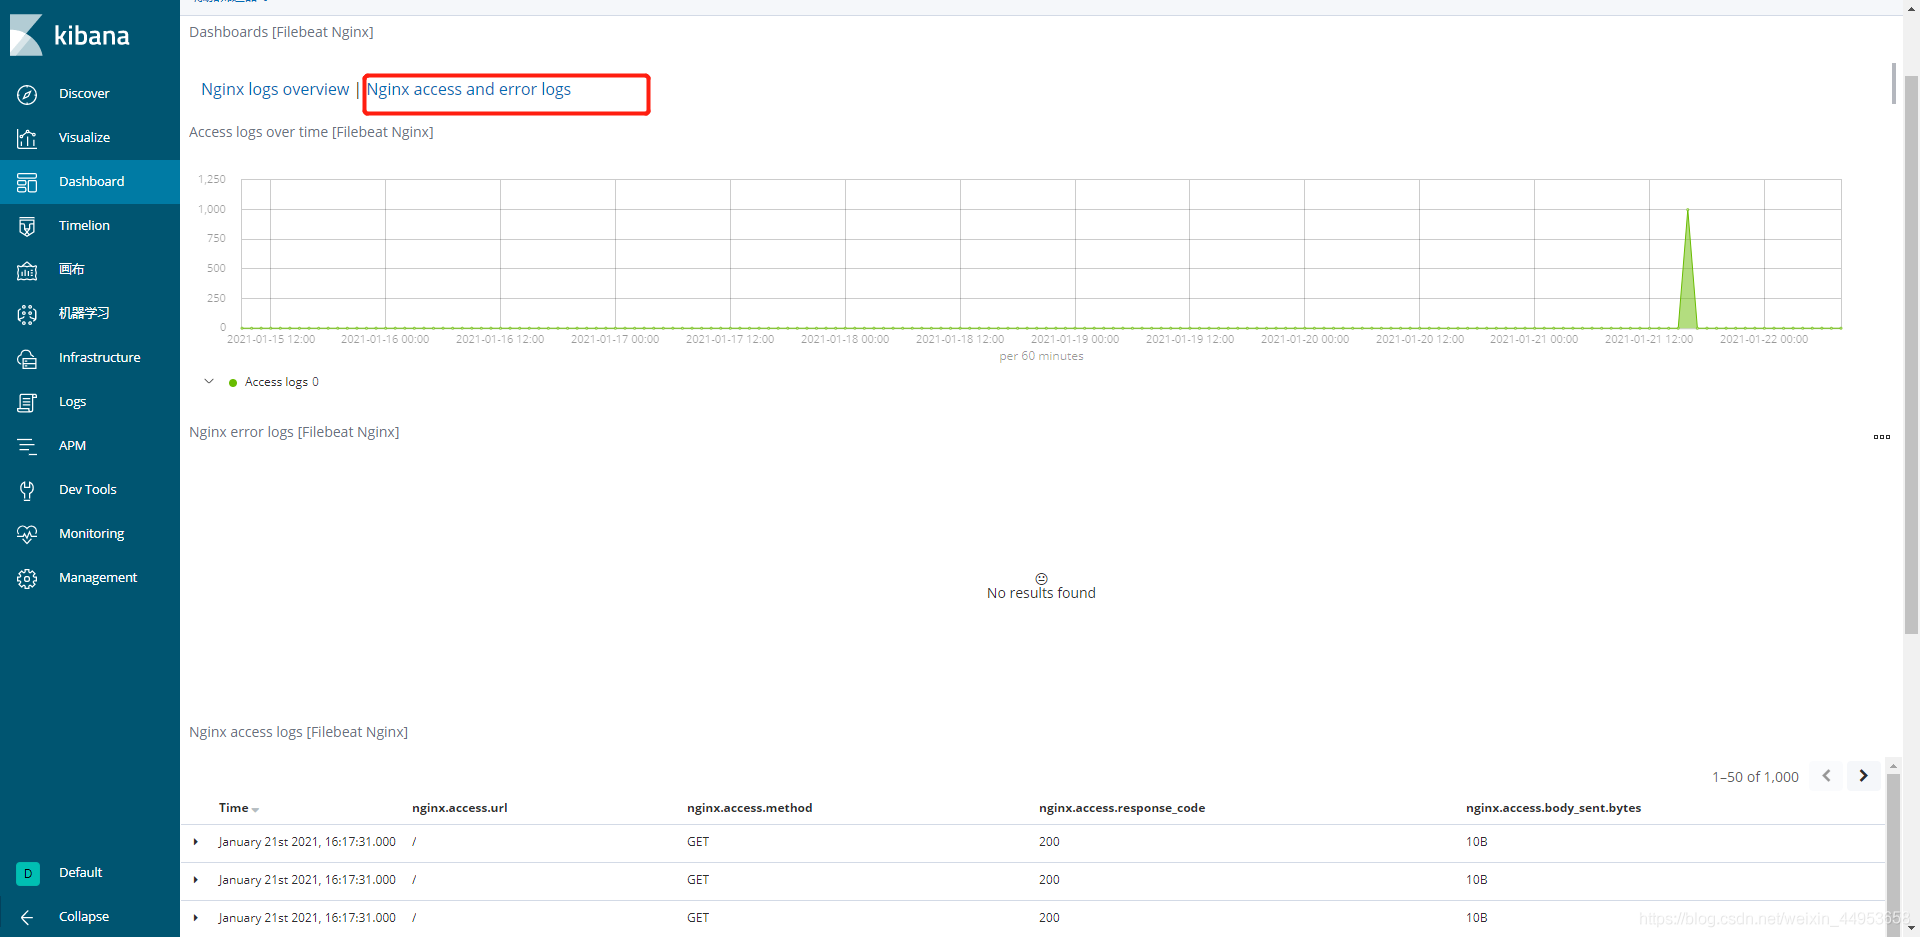
access and error仪表盘
3.对module收集日志不太满意的地方
- 使用module收集直接存储到默认的索引名下,不好区分
- access日志和error在同一个索引中,不好区分
针对以上两个问题,可以通过filebeat匹配规则,根据日志名去匹配,当日志名为xxx日志时就创建xxx的索引,既然是根据索引名去匹配,那么也就完美解决access和error日志存在一个索引的问题
3.1.使用module收集日志并自定义创建索引
在2里面已经实现了filebeat使用module收集nginx日志,但是创建的索引确实默认的,这点还是不太满意
在官方手册里module配置文件并没有参数去匹配条件创建索引
但是我们可以使用filebeat的匹配规则去指定索引名称,比如当日志为xxx时就创建xxx的索引名称
filebeat里不单单可以对标签进行匹配,也可以对某个字段去匹配规则,由于module配置文件无法指定tag,因此我们就对json数据的某一个字段来进行匹配,显然日志名是比较好匹配的
filebeat根据日志名去匹配的话,也可以完美解决access和error日志存在一个索引的问题
3.1.1.配置filebeat匹配module指定的路径并创建索引
只需要在filebeat配置文件中增加一个when匹配条件即可
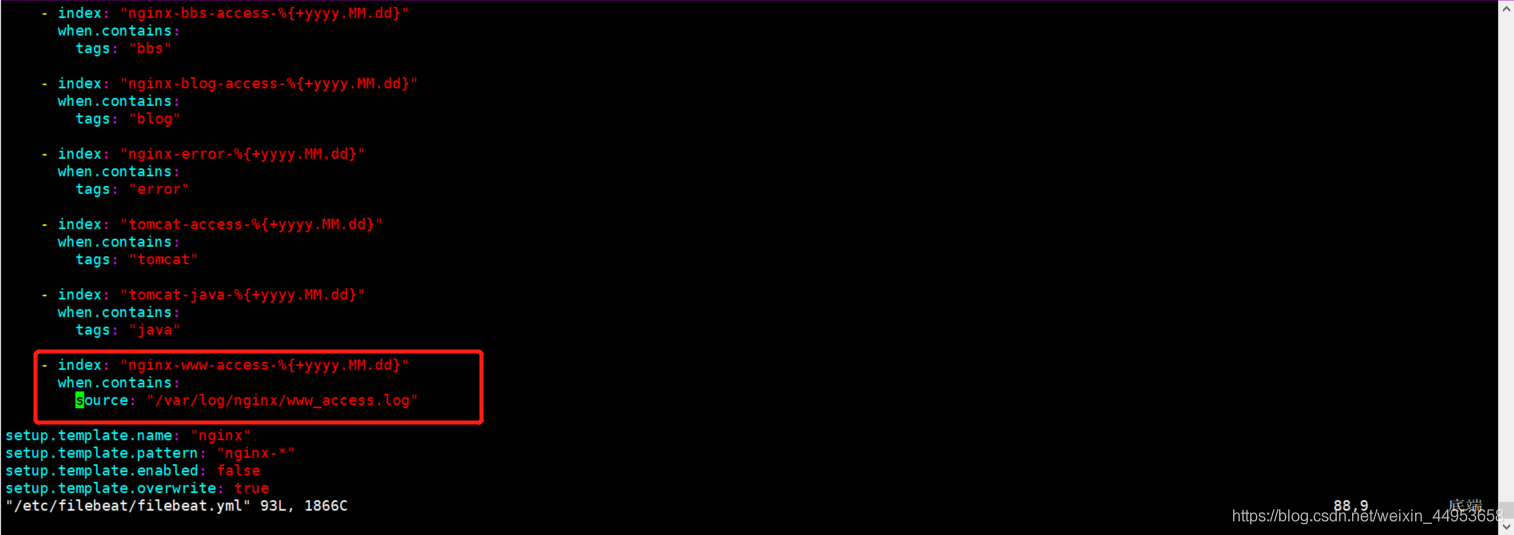
1.配置filebeat
[root@nginx02 ~]# vim /etc/filebeat/filebeat.yml
    - index: "nginx-www-access-%{+yyyy.MM.dd}"
      when.contains:
        source: "/var/log/nginx/www_access.log"

2.重启filebeat
[root@nginx02 ~]# systemctl restart filebeat
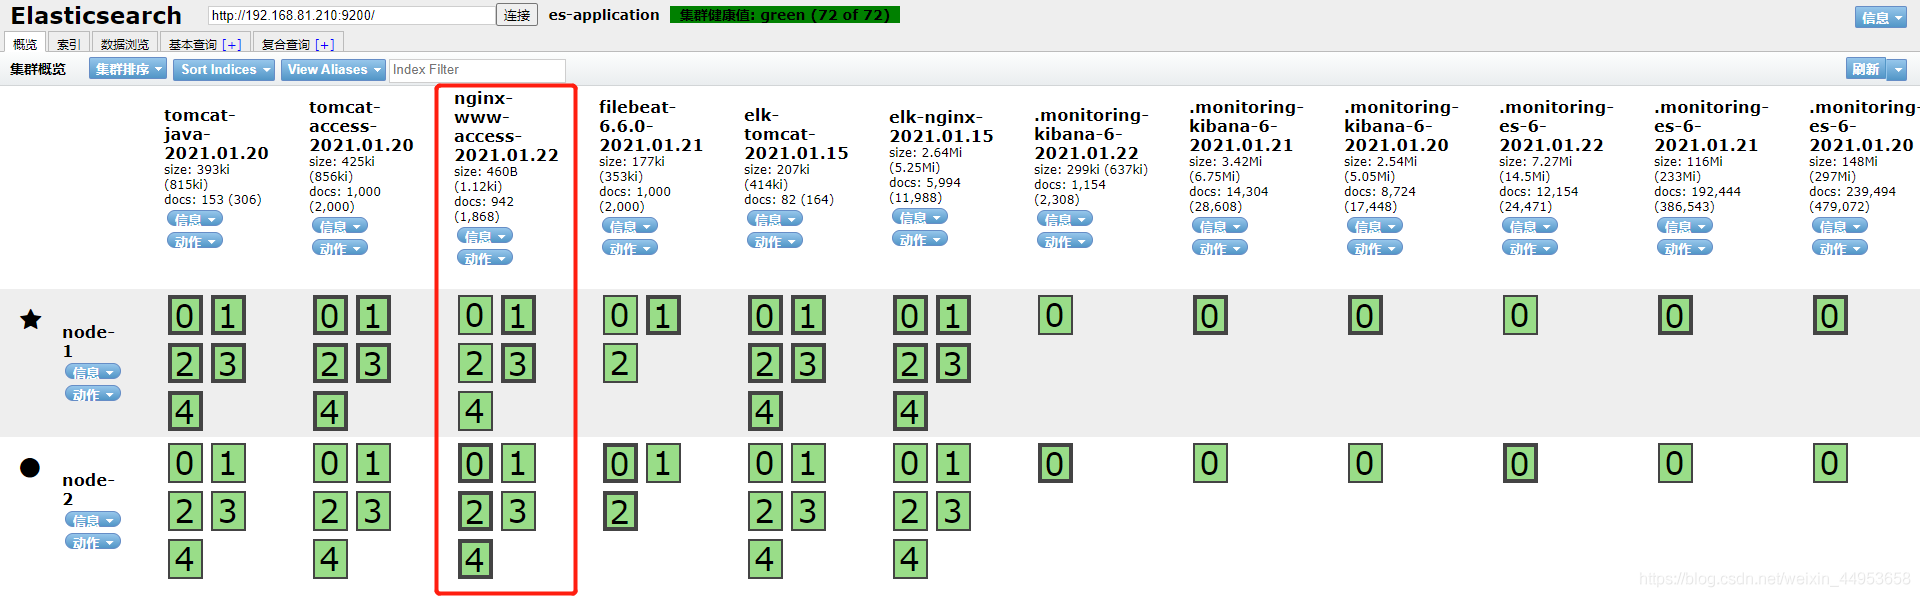
3.1.2.查看es是否产生了我们指定名称的索引
查看之前先使用ab命令生成几条访问日志
ab -c 100 -n 1000 http://www.jiangxl.com/
索引已经成功生成,
3.1.3.在kibana关联索引并查看收集来的数据
关联es索引
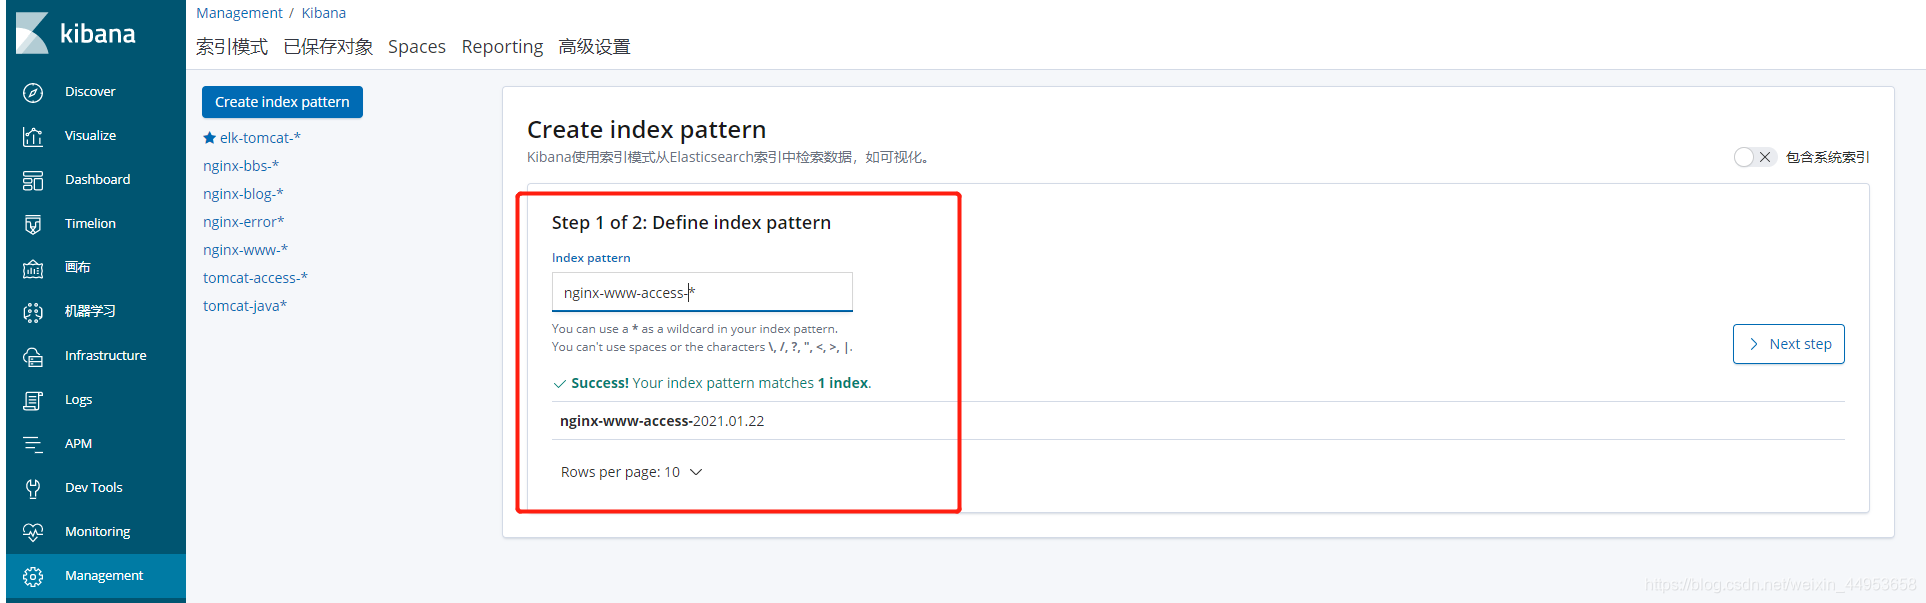
收集来的日志也是json格式的
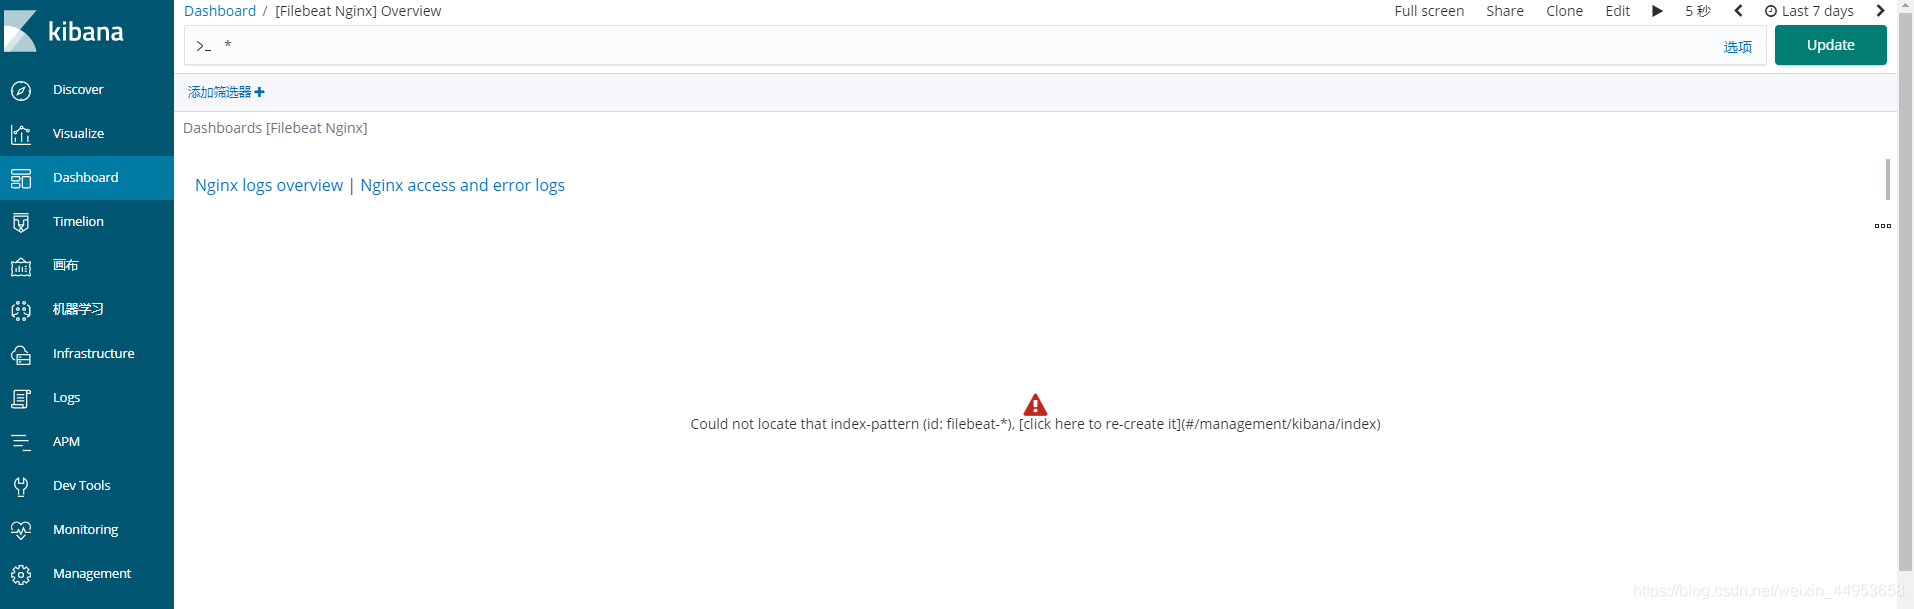
4.解决自定义module索引后dashboard无法展示问题
由于我们自定义了索引名称,而dashboard是把索引名称写死了,因此无法展示,只需要将dashboard中的索引修改成自己的索引即可
1.将module在kibana上的图形备份到其他路径
[root@nginx02 ~]# mkdir /data/kibana_module/kibana_module_nginx
[root@nginx02 ~]# cp -r  /usr/share/filebeat/kibana/ /data/kibana_module/kibana_module_nginx


2.只保留nginx的模板
[root@nginx02 ~]# /data/kibana_module/kibana_module_nginx/6
[root@nginx02 /data/kibana_module/kibana_module_nginx/6]# find dashboard/ -type f ! -name "*nginx*" |xargs rm -rf


3.修改模板文件中的索引名
首先检查下是不是真的修改了,在使用-i参数
[root@nginx02 /data/kibana_module/kibana_module_nginx/6]# sed -n 's#filebeat\-\*#nginx\-\*#gp' dashboard/Filebeat-nginx-overview.json

[root@nginx02 /data/kibana_module/kibana_module_nginx/6]# sed -i 's#filebeat\-\*#nginx\-\*#g' Filebeat-nginx-logs.json
[root@nginx02 /data/kibana_module/kibana_module_nginx/6]# sed -i 's#filebeat\-\*#nginx\-\*#g' Filebeat-nginx-overview.json

[root@nginx02 /data/kibana_module/kibana_module_nginx/6]# sed -i 's#filebeat\-\*#nginx\-\*#g' index-pattern/filebeat.json


4.指定新的module模板的路径
导入前先将kibana上原来的模板删掉
[root@nginx02 ~]# filebeat setup --dashboards -E setup.dashboards.directory=/data/kibana_module/kibana_module_nginx
Loading dashboards (Kibana must be running and reachable)
Loaded dashboards
查看图形已经能展示
4.故障排查恢复
4.1.filebeat module list无法使用
报错如下,该报错是指没有在配置文件中指定module文件的路径
[root@nginx02 /etc/filebeat]# filebeat modules list Error in modules manager: modules management requires 'filebeat.config.modules.path' setting
解决:在配置文件制定module文件路径即可
4.2.激活nginx modules报错
现象:配置完nginx modules后启动报错
报错内容如下:
2021-01-21T15:55:12.326+0800 ERROR pipeline/output.go:100 Failed to connect to backoff(elasticsearch(http://192.168.81.210:9200)): Connection marked as failed because the onConnect callback failed: Error loading pipeline for fileset nginx/access: This module requires the following Elasticsearch plugins: ingest-user-agent, ingest-geoip. You can install them by running the following commands on all the Elasticsearch nodes:
解决方法:
sudo bin/elasticsearch-plugin install ingest-user-agent sudo bin/elasticsearch-plugin install ingest-geoip

4.3.filebeat启用module图形展现报错
现象:执行filebeat startup -e报错
2021-01-21T20:14:10.888+0800 ERROR instance/beat.go:911 Exiting: fail to create the Kibana loader: Error creating Kibana client: Error creating Kibana client: fail to get the Kibana version: HTTP GET request to /api/status fails: fail to execute the HTTP GET request: Get http://localhost:5601/api/status: dial tcp [::1]:5601: connect: connection refused. Response: Exiting: fail to create the Kibana loader: Error creating Kibana client: Error creating Kibana client: fail to get the Kibana version: HTTP GET request to /api/status fails: fail to execute the HTTP GET request: Get http://localhost:5601/api/status: dial tcp [::1]:5601: connect: connection refused. Response:
[::1]:5601: connect: connection refused. Response:
Exiting: fail to create the Kibana loader: Error creating Kibana client: Error creating Kibana client: fail to get the Kibana version: HTTP GET request to /api/status fails: fail to execute the HTTP GET request: Get http://localhost:5601/api/status: dial tcp [::1]:5601: connect: connection refused. Response: `
解决办法:这是由于没有在filebeat配置kibana地址导致的,由于配置文件没有指定kibana地址,filebeat就认为自身是kibana,就访问了localhost:5601但是kibana中是无法写localhost地址的,写了localhost地址外界就不能访问,因此必须在filebeat中配置kibana地址就可以解决了
cs