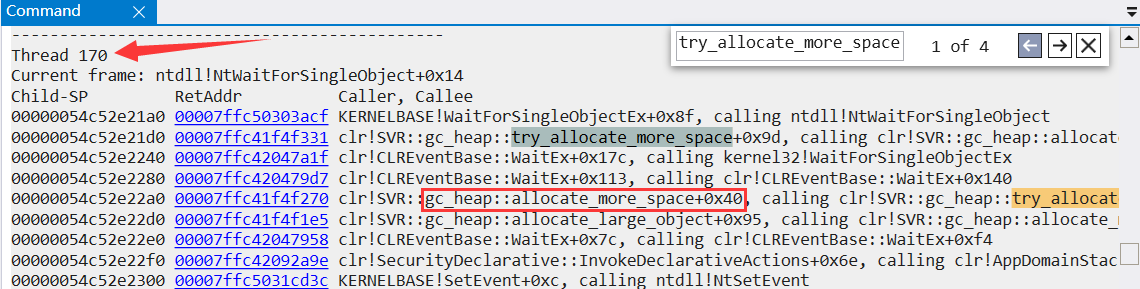
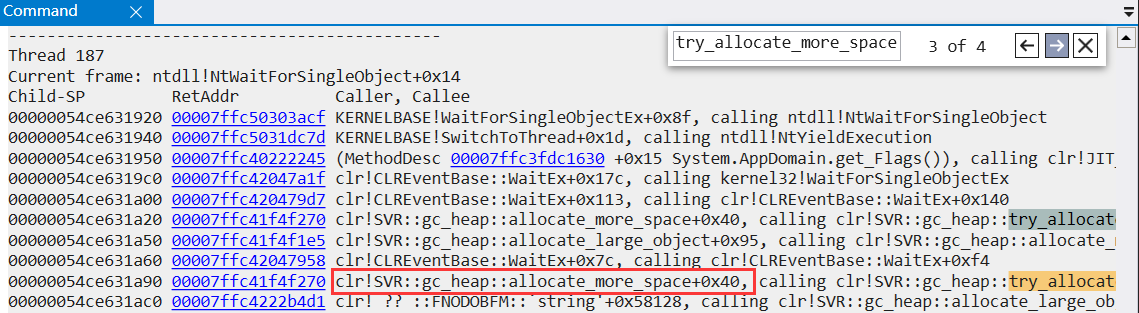
ДгЭМжаПЩвдПДГіЃЌЕБЧАга 40 ИіЯпГЬБЛзшШћСЫЃЌецКУЃЌЮЪЬтдНРДдНЧхЮњСЫЃЌНгЯТРДдйЗжЮіЕНЕзЪЧФФИіЯпГЬзіСЫЪВУДВЛИУзіЕФЪТЃЌЕМжТ GC ДЅЗЂЃЌЭЌбљвВПЩвдЫб try_allocate_more_space РДХаЖЯФФаЉЯпГЬе§дкЗжХфПеМфЁЃ
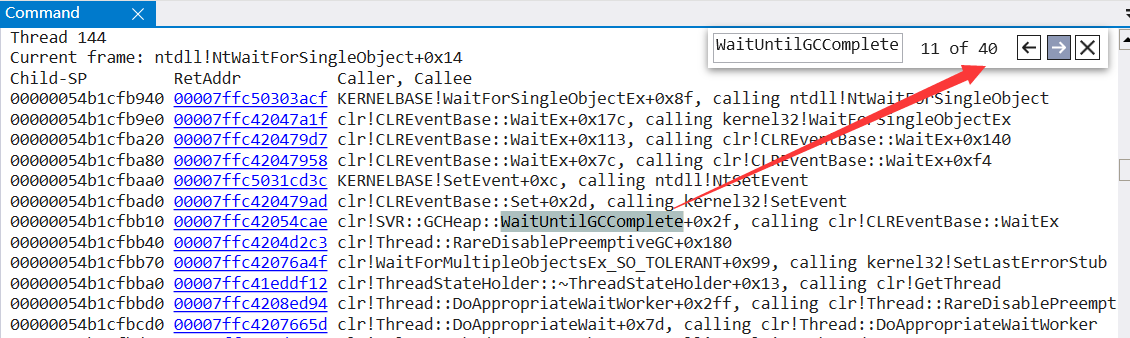
ЯждкЙизЂЕуОЭдкетСНИіЯпГЬЩЯСЫЃЌЮвПДСЫЯТетСНИіЯпГЬеЛЖМЪЧЭЌвЛДІЗНЗЈЃЌЫљвдетРяОЭЬєвЛИі 187 ЯпГЬРДЗжЮіАЩЃЌПЩвдгУ !clrstack ПДЯТЫќЕФЭаЙмеЛЁЃ
0:187> !clrstack
OS Thread Id: 0x1ef0 (187)
        Child SP               IP Call Site
00000054ce631e30 00007ffc4021bde2 System.String.FillStringChecked(System.String, Int32, System.String)
00000054ce631e70 00007ffc402222a8 System.String.ConcatArray(System.String[], Int32)
00000054ce631ed0 00007ffc40223528 System.String.Concat(System.String[])
00000054ce631f40 00007ffbe6dbdafb BLL.xxx.xxx.GetRowString(System.String, Boolean, Boolean, System.String, System.String, System.String, System.String, System.String, System.String, Int32, System.String, System.String, System.String, System.String, System.String, System.String, Int32, Int32, System.String, System.Nullable`1, System.Nullable`1, System.String, System.Nullable`1, System.Nullable`1, System.Nullable`1, System.Nullable`1, System.String, System.String, System.String, System.String, System.String ByRef)
00000054ce65cf40 00007ffbe6ab3187 BLL.xxx.xxx.ExpZB(System.String, Boolean, Boolean, System.String, System.String, System.String, System.String, Int32, System.String, System.String, System.String, Int32, System.String, System.String, System.String, System.String, System.String, System.String, Int32, Int32, System.String, System.Nullable`1, System.Nullable`1, System.String, System.Nullable`1, System.Nullable`1, System.Nullable`1, System.Nullable`1, System.String, System.String, System.String, System.String)
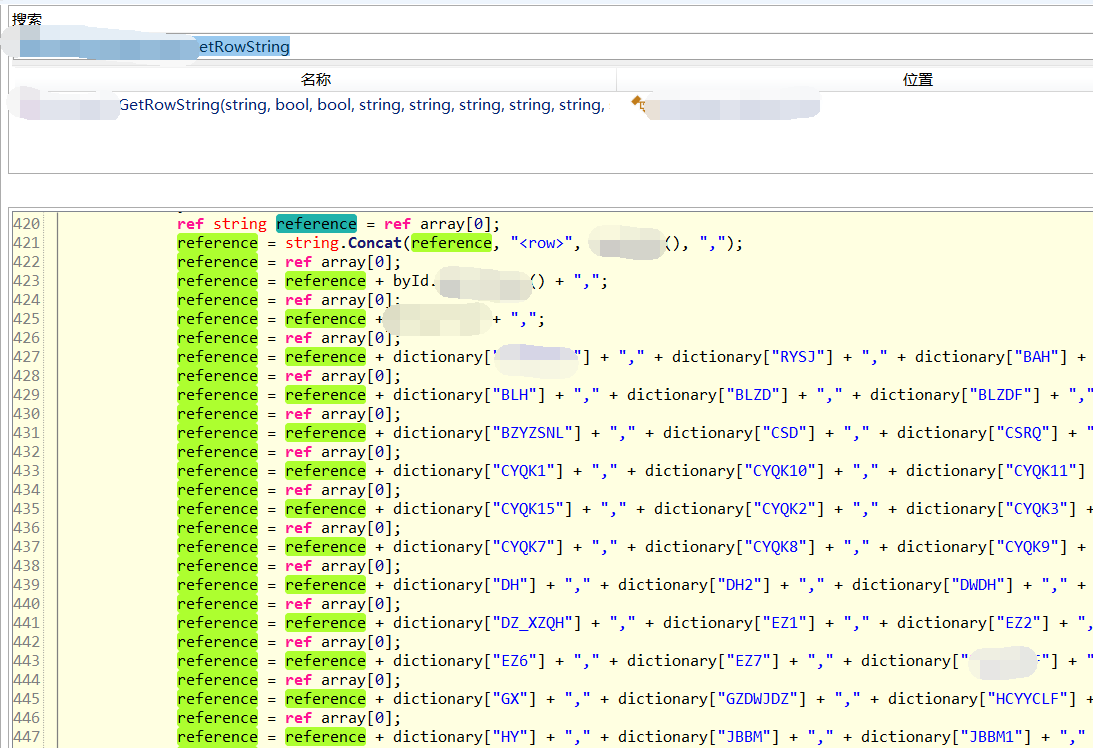
ДгЖбеЛЩЯПДЃЌУВЫЦЪЧЪЙгУСЫ System.String.Concat ЦДНг string ЫљжТЃЌКУМвЛяЃЌstring ЦДНгетУДЖрФъВЛжЊЕРБЛШЫХъЛїСЫЖрЩйДЮЃЌЛЙЪЧгаКмЖрЕФШЫВШПг??????ЃЌЮЊСЫНјвЛВНбщжЄЃЌПЩвдЪЙгУ !clrstack -p + !da -details xxx ПДПДетИі System.String[] ЕНЕзЪЧЪВУДЃЌМђЛЏШчЯТЃК
0:187> !clrstack -p
OS Thread Id: 0x1ef0 (187)
00000054ce631e70 00007ffc402222a8 System.String.ConcatArray(System.String[], Int32)
    PARAMETERS:
        values (<CLR reg>) = 0x000001ea69e8d2f8
        totalLength = <no data>
0:187> !da -details 0x000001ea69e8d2f8
Name:        System.String[]
Size:        128(0x80) bytes
Array:       Rank 1, Number of elements 13, Type CLASS
Element Methodtable: 00007ffc403d6948
[0] 000001f2391a83f0
    Name:        System.String
    MethodTable: 00007ffc403d6948
    EEClass:     00007ffc3fcd50e0
    Size:        445950(0x6cdfe) bytes
    File:        C:\Windows\Microsoft.Net\assembly\GAC_64\mscorlib\v4.0_4.0.0.0__b77a5c561934e089\mscorlib.dll
    String:      xxxxx
ДгЪфГіаХЯЂжаПЩвдПДЕНЃЌString[] РяУцга 13 ИідЊЫиЃЌЦфжазюДѓЕФвЛИі string ЪЧ 445950 bytes = 445kЃЌДѓгкДѓЖдЯѓЕФ85kНчЖЈЃЌЫљвдетРяЕФ Concat ОЭЪЧжЂНсЫљдкЃЌЭЌбљ 170 ЯпГЬвВЪЧШчДЫЃЌНгЯТРДЮвЛЙЕУвЊНтОіЕФвЛИіЮЪЬтЪЧЃКЮЊЪВУДЛсгаШчДЫДѓЕФзжЗћДЎВњЩњЃЌДњТыРяУцЕНЕззіСЫЪВУДЃПЃПЃП вЊЯыбАевД№АИЃЌЛЙЕУДгdumpжаЕМГідДТывЛЬНОПОЙЁЃ
5. ВщПДЮЪЬтДњТы
вЊЯыЗжЮіЮЪЬтДњТыЃЌПЩвдЭЈЙ§ !ip2md + !savemodule ЕМГі BLL.xxx.xxx.GetRowString ЗНЗЈЁЃ
0:187> !ip2md 00007ffbe6dbdafb
MethodDesc:   00007ffbe5342118
Method Name:  BLL.xxx.xxx.GetRowString(System.String, Boolean, Boolean, System.String, System.String, System.String, System.String, System.String, System.String, Int32, System.String, System.String, System.String, System.String, System.String, System.String, Int32, Int32, System.String, System.Nullable`1<Int32>, System.Nullable`1<Int32>, System.String, System.Nullable`1<Single>, System.Nullable`1<Single>, System.Nullable`1<Single>, System.Nullable`1<Single>, System.String, System.String, System.String, System.String, System.String ByRef)
Class:        00007ffbe52fe328
MethodTable:  00007ffbe53421d8
mdToken:      0000000006000096
Module:       00007ffbe471a890
0:187> !savemodule  00007ffbe471a890 E:\dumps\RowString.dll
3 sections in file
section 0 - VA=2000, VASize=f7fcc, FileAddr=200, FileSize=f8000
section 1 - VA=fa000, VASize=3bc, FileAddr=f8200, FileSize=400
section 2 - VA=fc000, VASize=c, FileAddr=f8600, FileSize=200
ШЛКѓМРГі ILSpy ЗДБрвыетЖЮДњТыЁЃ
КУМвЛяЃЌетаДЗЈец????ЃЌЮоЪ§ЕФзжЗћДЎЦДНгЃЌЮвЖМИаОѕ gen КЭ LOH ЖМРДВЛМАЗжХфФкДцЖЮСЫ??????ЃЌецЕФЪЧКІЫР GC СЫЁЃЁЃЁЃ
Ш§ЃКзмНс
ЦфЪЕетЪЧвЛИіНЬПЦЪщЪНЕФЮЪЬтЃЌвВгаНЬПЦЪщЪНЕФНтОіЗНЗЈЃЌЖјЧвЮвПДСЫЯТетИіЗНЗЈга 600 ЖрааЕФДњТыЃЌЛљБОЩЯЖМЪЧзіstringЦДНгЕФЪТЃЌзюКѓЫЕвЛЯТНтОіЗНАИЁЃ
- жиЙЙИУЗНЗЈЃЌОЁСПгУ StringBuilder ЬцДњ StringЃЌНЋвђетжж GC ДЅЗЂЕФДЮЪ§НЕЕНзюЕЭЁЃ
зюКѓЕФаЁВЪЕАЃЌУВЫЦетИіЗжЮіНсЙћКЭХѓгбЕФЩюЖШЛГвЩВЛдМЖјЭЌЁЃЁЃЁЃ

ИќЖрИпжЪСПИЩЛѕЃКВЮМћЮвЕФ GitHub: dotnetfly

bk